Patent Reform is Working, Everywhere but the Eastern District of Texas?

Is the American Invents Act working?

Taking a look at the longterm trends in case filings and the number of unique defendants in each suit, it appears that the America Invents Act (“AIA”) corresponds with a significant reduction in the real rate of patent litigation and a leveling off of the nominal rate of patent litigation.

Patent Cases Filed and Estimated Number of Defendants, 1994—2015

Figure 5

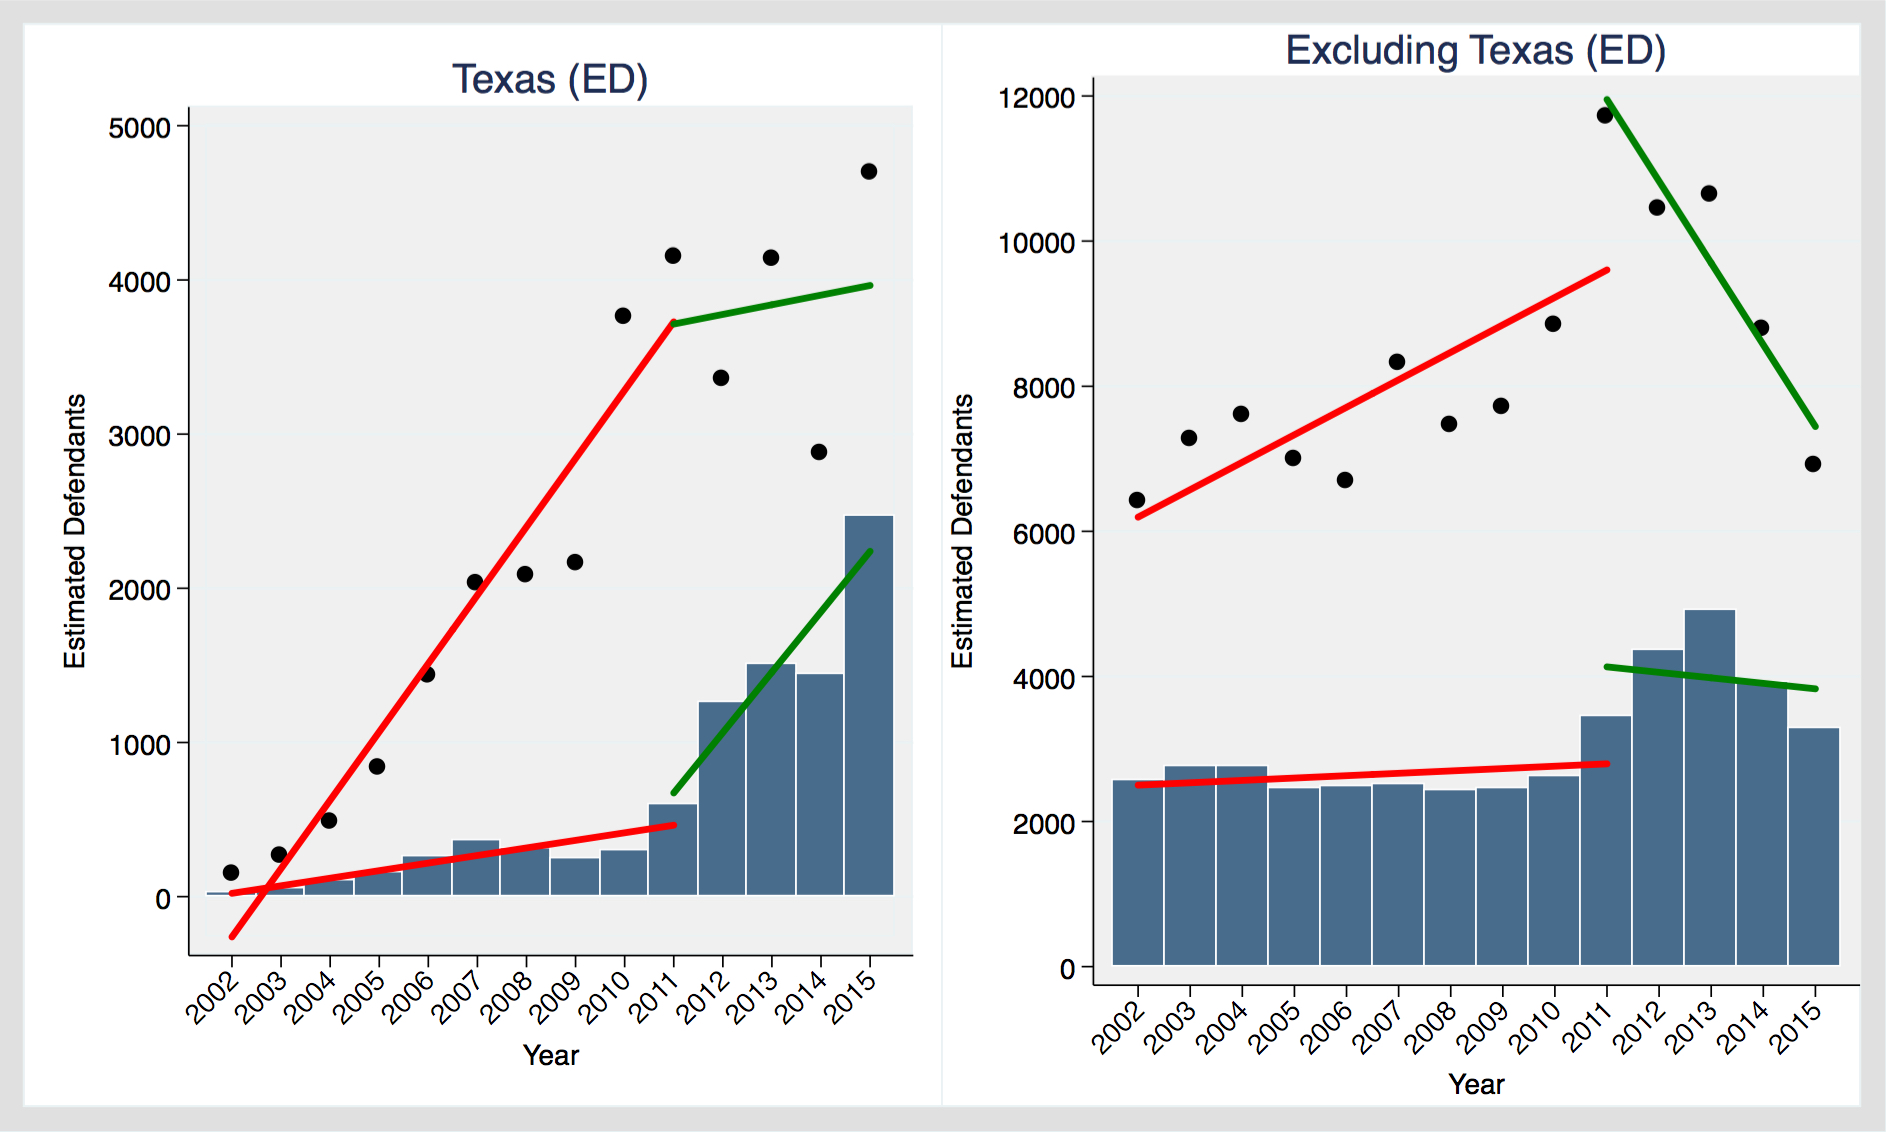
However it is worth desegregating the data to compare the Eastern District of Texas to the rest of the United States. If you believe that most what takes place in Eastern District is patent trolling, then it looks like the AIA has not put a serious dent in that activity. The figure below compares the Eastern District of Texas to the rest of the United States in terms of the number of patent lawsuits filed per year (the bars) and also the estimated number of defendants per year (the scatterplot).

Patent Litigation in Eastern District of Texas, All Other Districts Source: Bloomberg Law, 1994–2015.

comparingtexas

Bar chart depicts cases filed. Scatterplot depicts estimated number of defendants. Linear fit lines from 1994 to 2011 and 2011 to 2015.

Prior to 2011, the whole country witnessed a significant upward trend in patent suits and patent defendants. The rate of increase was much greater in the Eastern District of Texas, but the trendlines were pointed in the same direction for the district and the rest of the US. The period from 2011 to 2015 saw a marked divergence between the Eastern District of Texas and the rest of the country. In the Eastern District, the number of cases filed increased sharply and the trend (albeit with significant variation) was for the number of defendants to increase as well. In the rest of the US, the trendline for the number of defendants is significantly downward and there also appears to be a decreasing trend in terms of the number of suits filed.

These initial numbers might suggest that the patent reform measures introduced in the AIA have had a significant impact on the extent of patent litigation everywhere but the Eastern District of Texas. Another way to read these figures is as confirmation that the Eastern District of Texas’s concerted efforts at forum selling are continuing to be successful. These explanations are not mutually exlusive. The Eastern District of Texas accounted for just 7.33% of all patent cases filed between 2002 and 2010, but 26% from 2011 to 2015. It accounted for 16.39% of all patent defendants between 2002 and 2010, rising to 28.36% in the 2011-2015 period.

According to this superficial data (no attempt to control for marco-economic factors), etc, it looks like the AIA is having an effect, just not in the Eastern District of Texas.

For an extended discussion of the data used in this post, see my forthcoming article, IP Litigation in United States District Courts: 1994 to 2014 (Iowa Law Review, forthcoming 2016). You can download the underlying data on my website (under the publications+/data sets tab).

(4/4) 2015 Data on the geographic distribution of US IP litigation

2015 Update

This is the fourth and final post in a series discussing the 2015 Update to the data in my forthcoming article, IP Litigation in United States District Courts: 1994 to 2014 (Iowa Law Review, forthcoming 2016). You can read the 2015 Update in serial form in the posts that follow, or you can download the entire update as a pdf file from ssrn.com. See Suggested citation, Matthew Sag, IP Litigation in United States District Courts2015 Update (January 5, 2016). Available at SSRN: http://ssrn.com/abstract=2711326.

The previous post discussed recent trends in patent litigation and the true nature of the patent litigation explosion. This post concludes with an update to the data concerning the geographic distribution of copyright, patent and trademark litigation in US district courts.

4. The geographic distribution of copyright, patent and trademark litigation

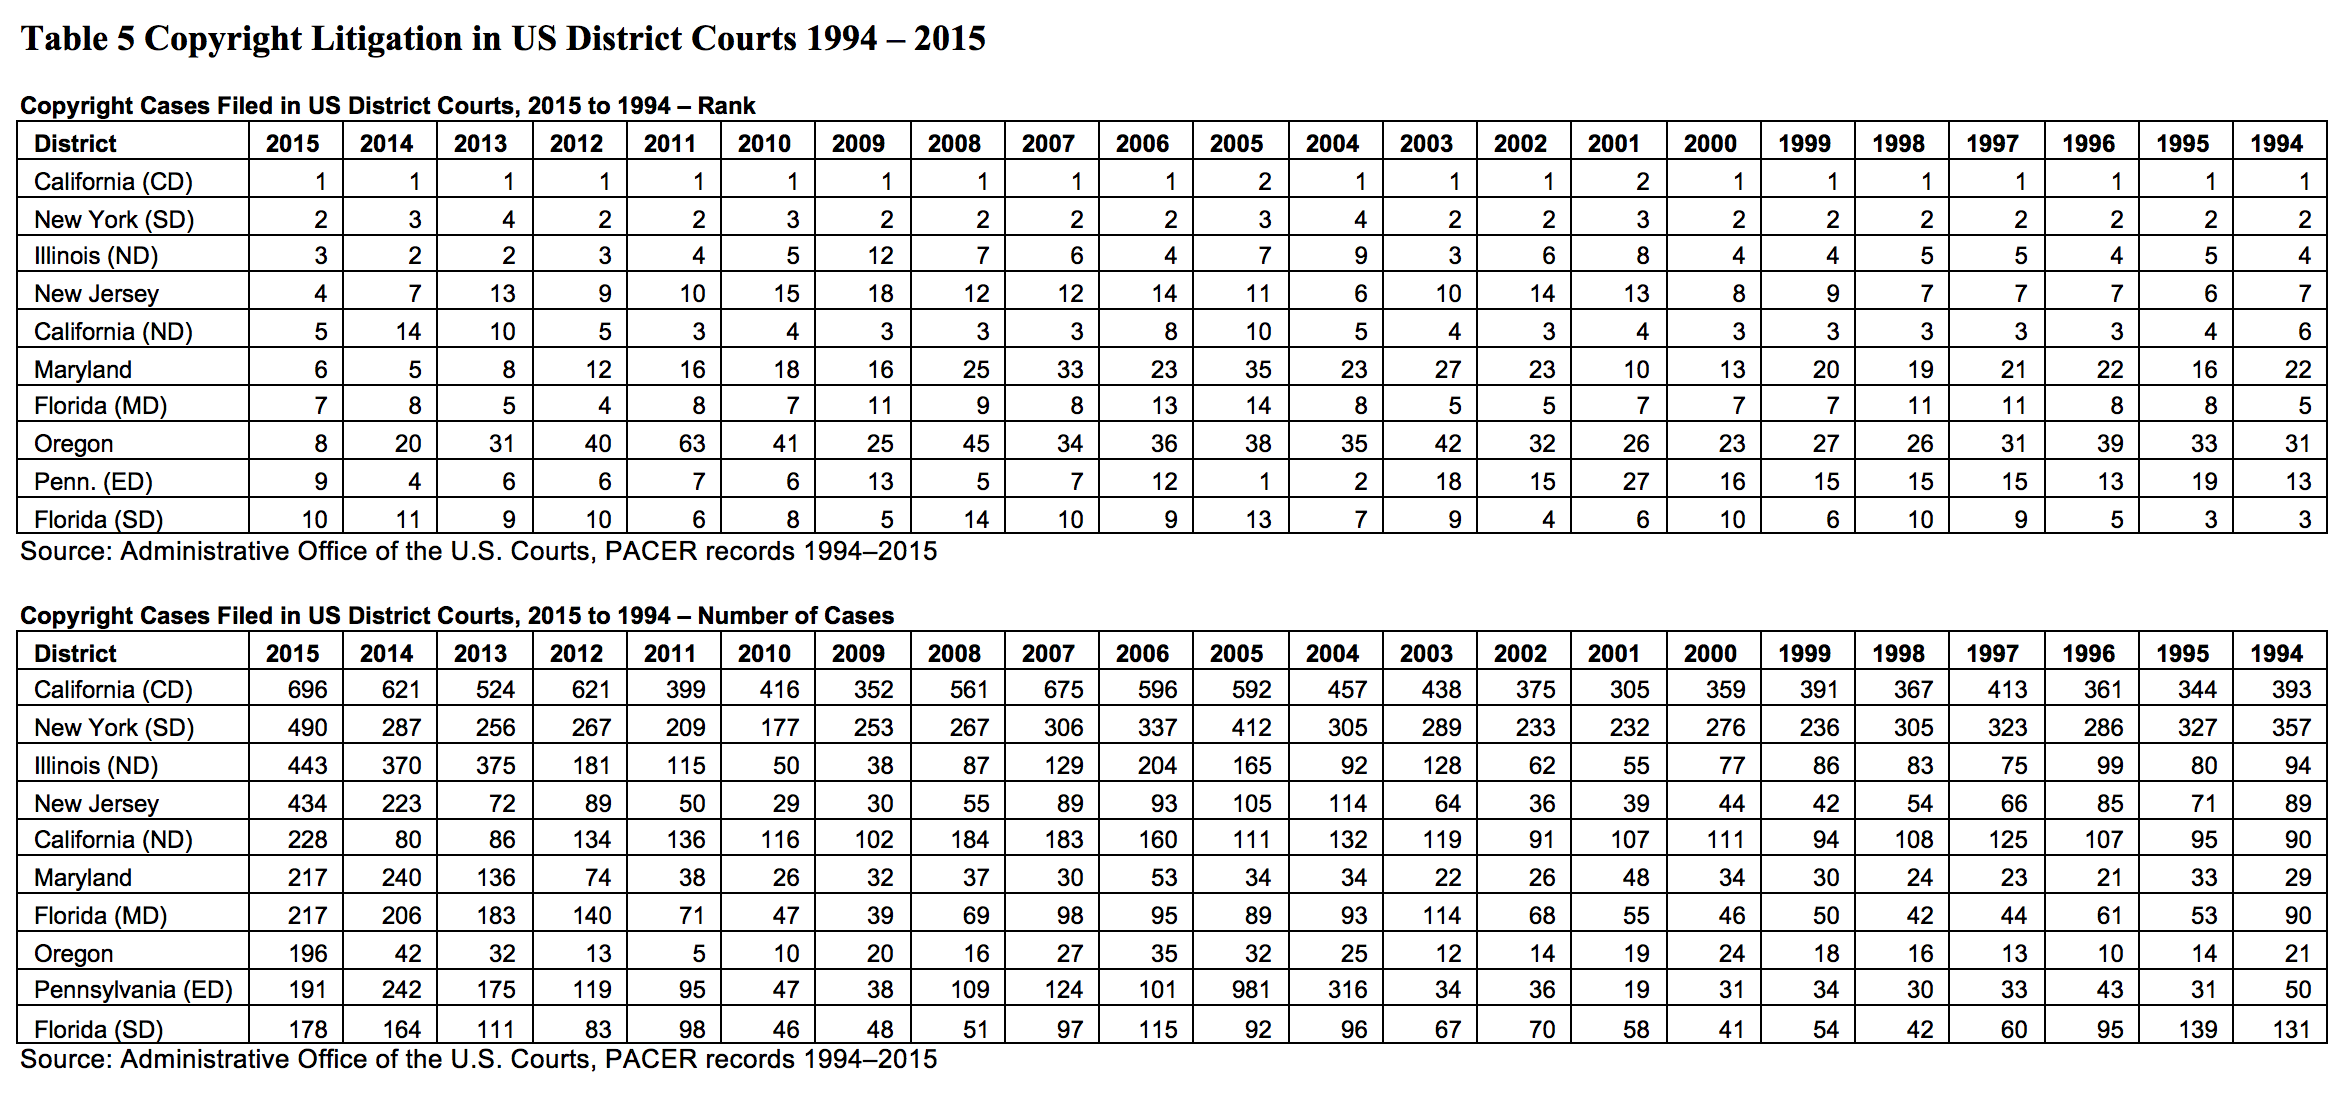
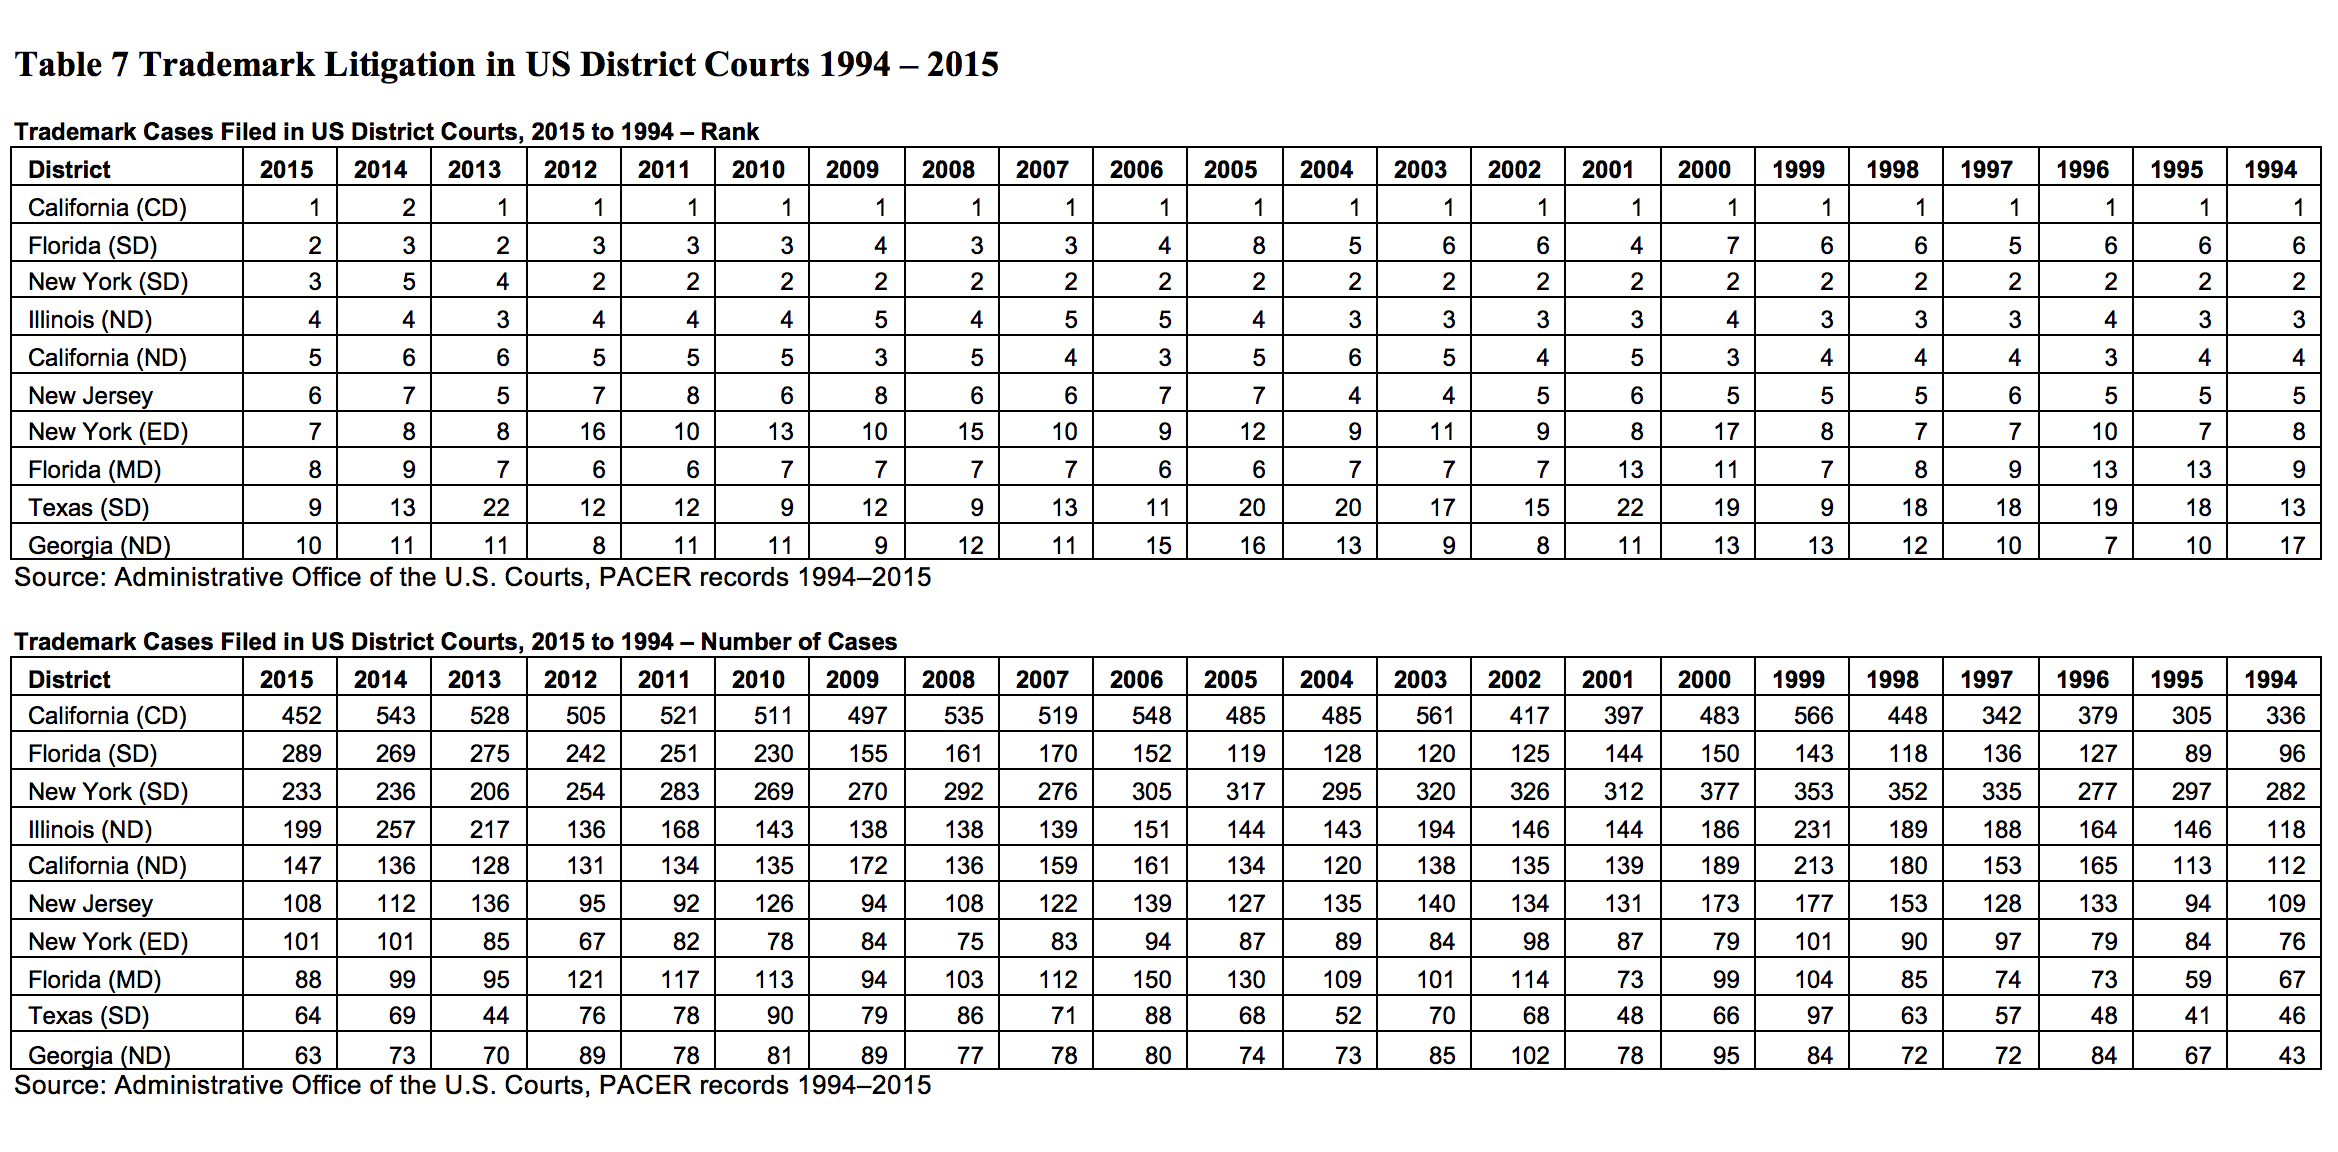
In  IP Litigation in United States District Courts: 1994 to 2014, I discussed at length the geographic distribution of copyright, patent and trademark litigation. I have updated the key figures and tables from that discussion below. Figure 6 (below) illustrates how the copyright, patent and trademark litigation rankings of selected districts have varied from 1994 to 2015.

Figure 6 Copyright, Patent and Trademark Litigation Rankings by District 1994—2014

Spagetti Districts Combined

Source: Administrative Office of the U.S. Courts, PACER records, 1994—2015.

The associated tables are not particularly easy to read in this format, but I have included them for completeness. They are available in text form in the pdf version of this Update, see Matthew Sag, IP Litigation in United States District Courts2015 Update (January 5, 2016)(http://ssrn.com/abstract=2711326).

Screen Shot 2016-01-05 at 11.27.51 AM

Screen Shot 2016-01-05 at 11.28.11 AM

Screen Shot 2016-01-05 at 11.28.25 AM

End of post

(3/4) 2015 Data on Patent Litigation in the US

2015 Update

This is the third  in a series of posts discussing the 2015 Update to the data in my forthcoming article, IP Litigation in United States District Courts: 1994 to 2014 (Iowa Law Review, forthcoming 2016). You can read the 2015 Update in serial form in the posts that follow, or you can download the entire update as a pdf file from ssrn.com. See Suggested citation, Matthew Sag, IP Litigation in United States District Courts2015 Update (January 5, 2016). Available at SSRN: http://ssrn.com/abstract=2711326.

The previous post discussed new data on copyright litigation and the John Doe phenomenon, this post examines recent trends in patent litigation and the true nature of the patent litigation explosion.

3. Patent Litigation

As I explained in IP Litigation in United States District Courts: 1994 to 2014, the filing data gives a misleading impression of the true extent of patent litigation because the rules relating to joinder changed in 2011 with the passage of the America Invents Act. At first glance, it looks as though there was an enormous spike in patent litigation between 2010 and 2012; however, this spike is at least partly attributable to an important procedural change brought about by the AIA. Prior to the AIA, it was common for patent plaintiffs to join multiple unrelated defendants in a single lawsuit based on a commonly-asserted patent or patents. The AIA ended this ruse and resulted in a nominal explosion of patent infringement lawsuits. Figure 4 (below) shows the number of cases filed in each year from 1994 2015 (see the gray bars) but it also shows the estimated number of defendants for each year. Essentially, prior to the America Invents Act of 2011, the true extent of litigation was disguised through permissive joinder of unrelated (or tenuously related) parties. This practice was particularly common in the Eastern District of Texas, the patent troll’s favorite hunting ground (see Figure 5 (below)). Note that although the trend in patent case filings is more or less flat between 2012 and 2015, the number of patent defendants has sharply declined over the same period.

Figure 4 Patent Cases Filed and Estimated Number of Defendants, 1994—2015

Figure 5

Source: Bloomberg Law, 1994–2015. Bar chart depicts cases filed. Scatterplot depicts estimated number of defendants. Quadratic fit lines from 1994 to 2010 and 2012 to 2015 are drawn for illustrative purposes.

The data underlying Figure 4 is also presented in tabular form below.

Table 4 Patent Defendants 1994—2015

Screen Shot 2016-01-05 at 11.18.40 AM

Figure 5 Average Number of Patent Defendants per Filing 1994–2015

figure 6

Source: Bloomberg Law, 1994–2015.

Figure 5 (above) shows the estimated number of defendants per suit for the nine most popular federal districts from 1994 to 2015 and also for an aggregation of all other districts. The vertical dashed line is set to 2011 to mark the passage of the AIA. It is starkly apparent that the trend toward more defendants was driven by the Eastern District of Texas. The estimated number of defendants in Eastern District of Texas climbed steeply from 1.66 in 1994 to 12.37 in 2010 and then dropped precipitously down to 1.99 in 2014. It has fallen further in 2015, to 1.90 defendants per suit.

End of post.

(1/4) 2015 Data on IP Litigation in US District Courts

Introduction to the 2015 Update

This is the first in a series of posts discussing the 2015 Update to the data in my forthcoming article, IP Litigation in United States District Courts: 1994 to 2014 (Iowa Law Review, forthcoming 2016).

My original piece, IP Litigation in United States District Courts, undertakes a broad-based empirical review of Intellectual Property (IP) litigation in United States federal district courts from 1994 to 2014. This brief update extends that data to include the year 2015. For a detailed discussion of the data sources and methods, please refer to the original article.

This update contains new data on

  1.  the overall state of copyright, patent and trademark litigation,
  2. copyright litigation and the John Doe phenomenon,
  3. the continuation of the patent litigation explosion and
  4. the geographic distribution of copyright, patent and trademark litigation.

You can read the 2015 Update in serial form in the posts that follow, or you can download the entire update as a pdf file from ssrn.com. See Suggested citation, Matthew Sag, IP Litigation in United States District Courts2015 Update (January 5, 2016). Available at SSRN: http://ssrn.com/abstract=2711326.

1. Copyright and Patent Litigation Increasing, Trademark Litigation Declining

The two most important trends in IP litigation over the last five years have been the extraordinary increase in patent and copyright litigation and the corresponding relative decline of federal trademark litigation. These trends continued in 2015.

Figure 1: Copyright, Patent and Trademark Filings 1994—2015 (Percent)

Figure 1

Twelve month moving average of percent of Federal IP litigation. Source: Administrative Office of the U.S. Courts, PACER records, 1994—2015.

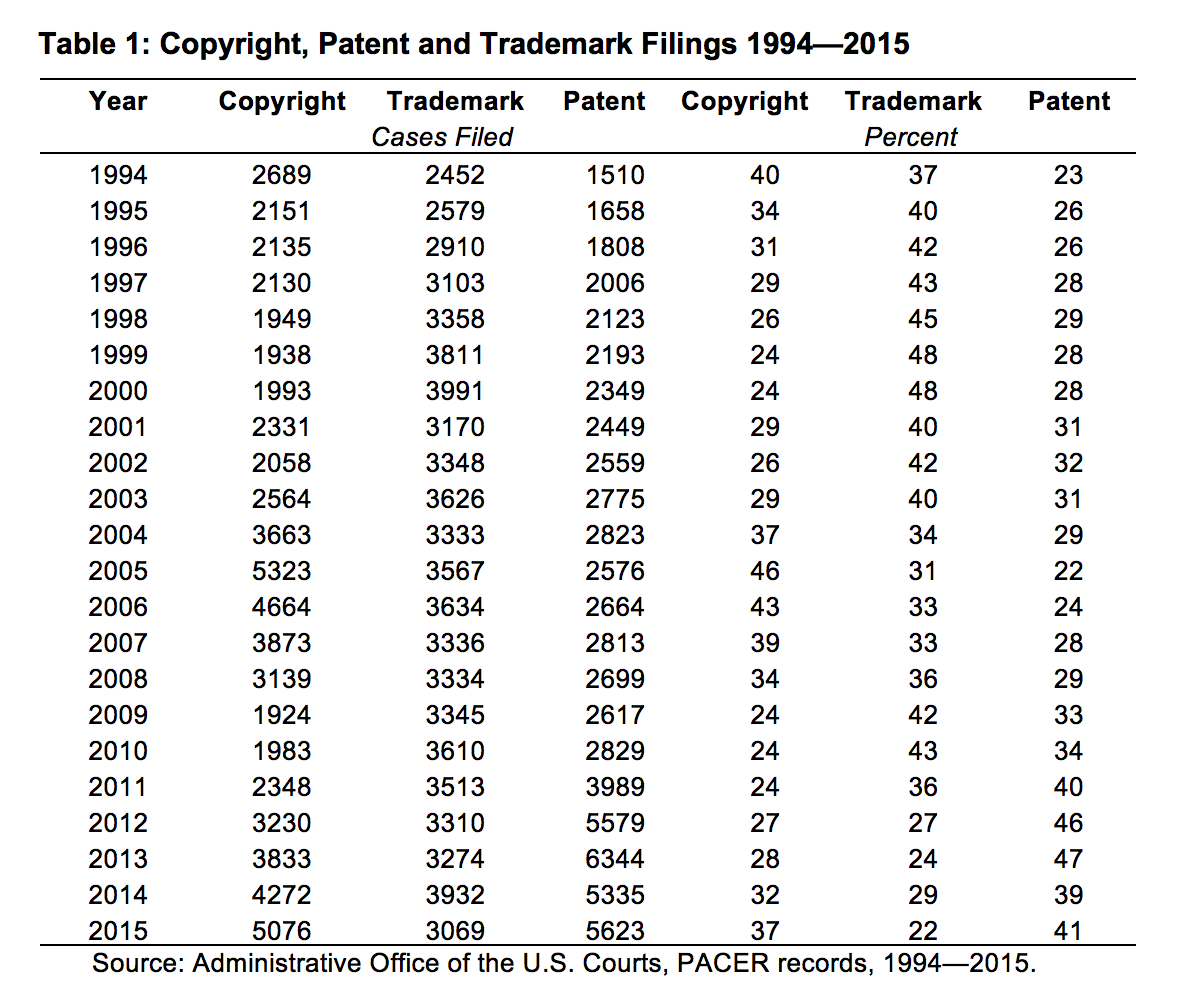
Figure 1 (above) shows the relative proportions of copyright, patent and trademark cases filed, based on a 12 month moving average between 1994 and 2015. As the figure makes plain, the relative shares of copyright, patent and trademark have fluctuated quite significantly over the period. The proportion of cases in the federal IP docket did not change significantly from 2014 to 2015 (39% in 2014, 41% in 2015); however, copyright increased significantly from 32% to 37% and this was matched by a corresponding decline in trademark litigation from 29% to 22%. Complete year-by-year data from 1994 to 2015 are presented in Table 1 (below).

Table 1: Copyright, Patent and Trademark Filings 1994—2015

Screen Shot 2016-01-05 at 10.54.11 AM

The increase in copyright and patent litigation can be seen even more clearly in Figure 2 (below) which shows the raw number of cases filed for each type of IP (displayed as a 12 month moving average).

Figure 2 Copyright, Patent and Trademark Filings 1994—2015 (Cases)

Figure 2

Twelve month moving average of cases filed. Source: Administrative Office of the U.S. Courts, PACER records, 1994—2015.

End of post

Some cool graphs from my paper on IP litigation in US district courts

I have just revised my article, IP Litigation in US District Courts: 1994 to 2014, which will be published in Volume 101 of the Iowa Law Review next year.  (You can download the article from ssrn now.) This post does not attempt to summarize the full article; it focuses instead on explaining some of the more interesting graphs and data visualizations in the article.

Copyright, Patent and Trademark Filings as a percentage of all IP 1994-2014

This data is presented as a 12 month moving average.
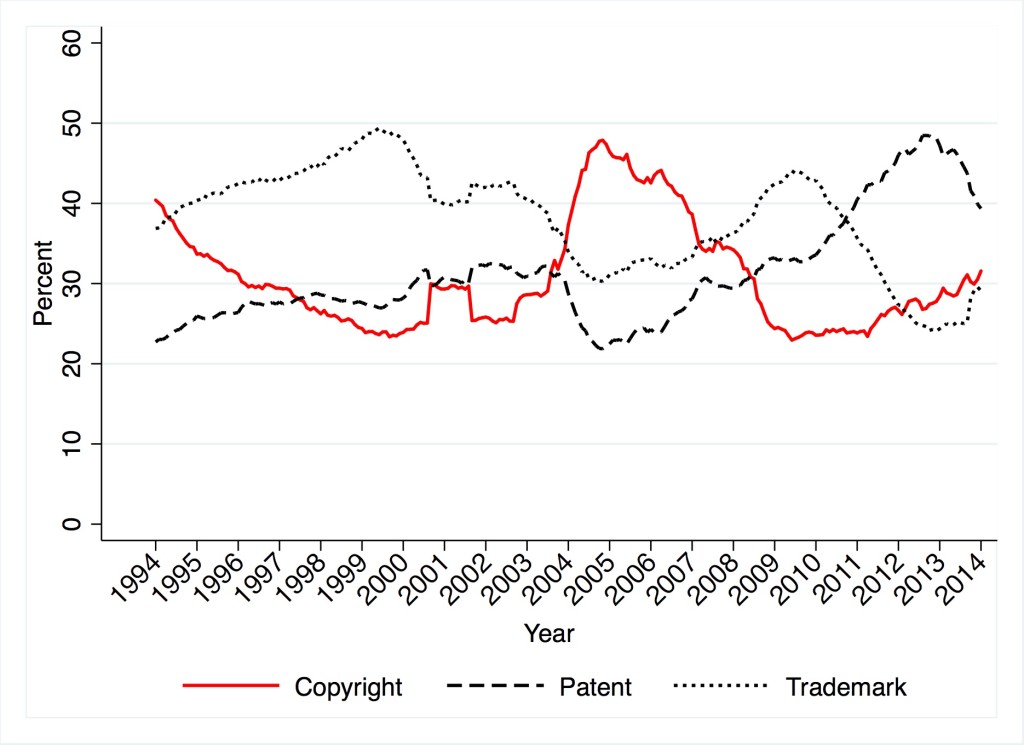
Copyright, Patent and Trademark Filings 1994—2014 (Percent)


Copyright, Patent and Trademark Filings (number of cases) 1994—2014

Again, this data is presented as a 12 month moving average. The difference between the dashed redline and the solid red line clearly shows the impact of lawsuits against anonymous internet file sharers.
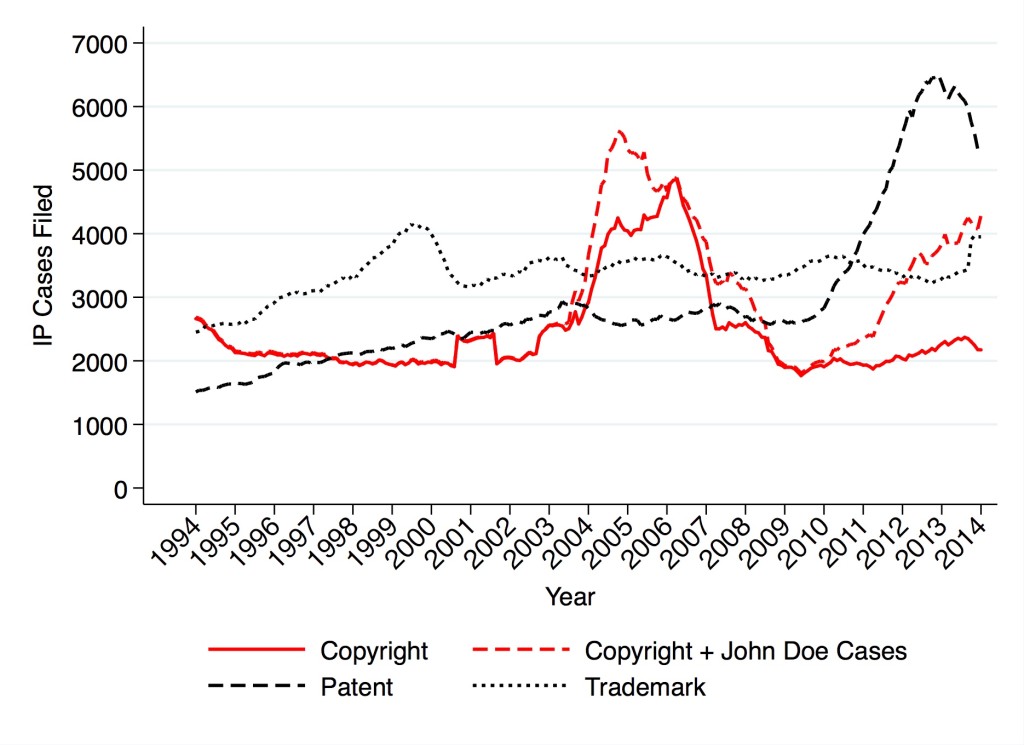
Copyright, Patent and Trademark Filings 1994—2014 (Cases)


Copyright Cases 1994—2014, RIAA End-User Litigation, BitTorrent Monetization and Copyright Trolling

The impact of the current wave of copyright trolling is pretty clear.
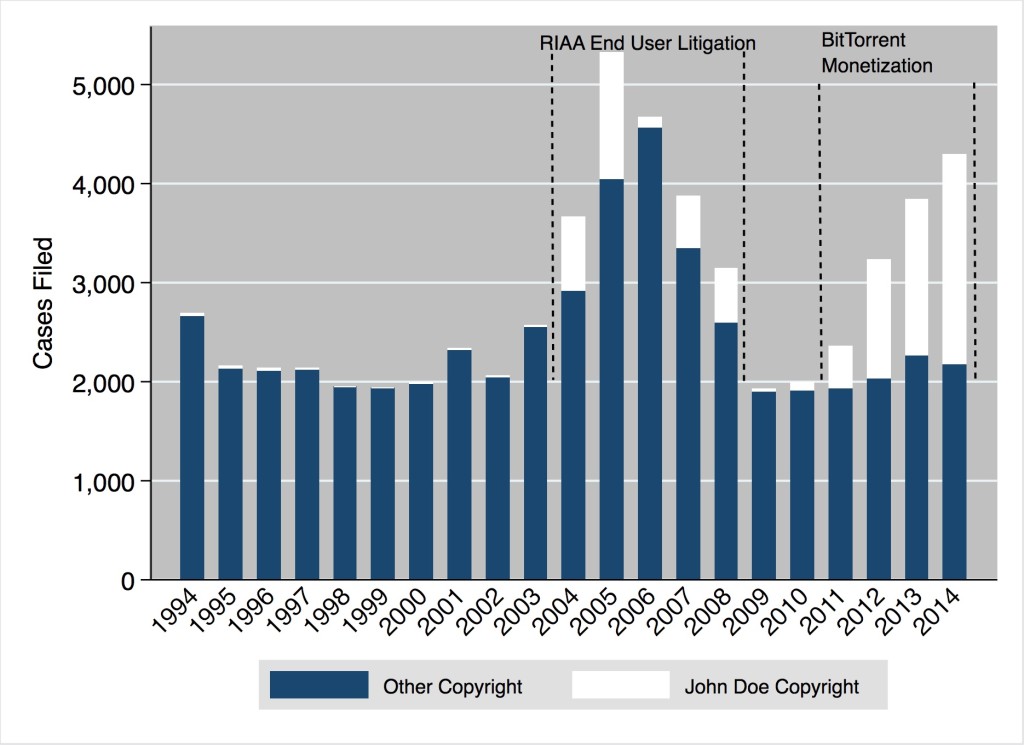
Copyright Cases Filed in U.S. District Courts (1994—2014)


9 out of 10 of ‘copyright trolling’ cases are about pornography

As you can see from the table, the number of john does per suit has declined because courts have been far more skeptical of mass-joinder, but that has just led to more suits being filed.

Screen Shot 2015-08-20 at 11.03.56 AM


One pornography company accounts for 80% of Copyright John Doe lawsuits filed in 2014 #CopyrightTrolling

In fact, the pornography producer, Malibu Media is such a prolific litigant that in 2014 it was the plaintiff in over 41.5% of all copyright suits nationwide. John Doe litigation is not a general response to Internet piracy; it is a niche entrepreneurial activity in and of itself.

[Edited at 4:17pm. The missing * for AF Holdings has been added]


Screen Shot 2015-08-20 at 4.15.40 PM

1/2 The patent litigation explosion is not exactly as it appears, compare suits filed to #defendants.

At first glance it looks like the annual volume of patent litigation in the United States doubled in the 16 years from 1994 until 2010. In the three years from 2010 to 2013 it doubled again.
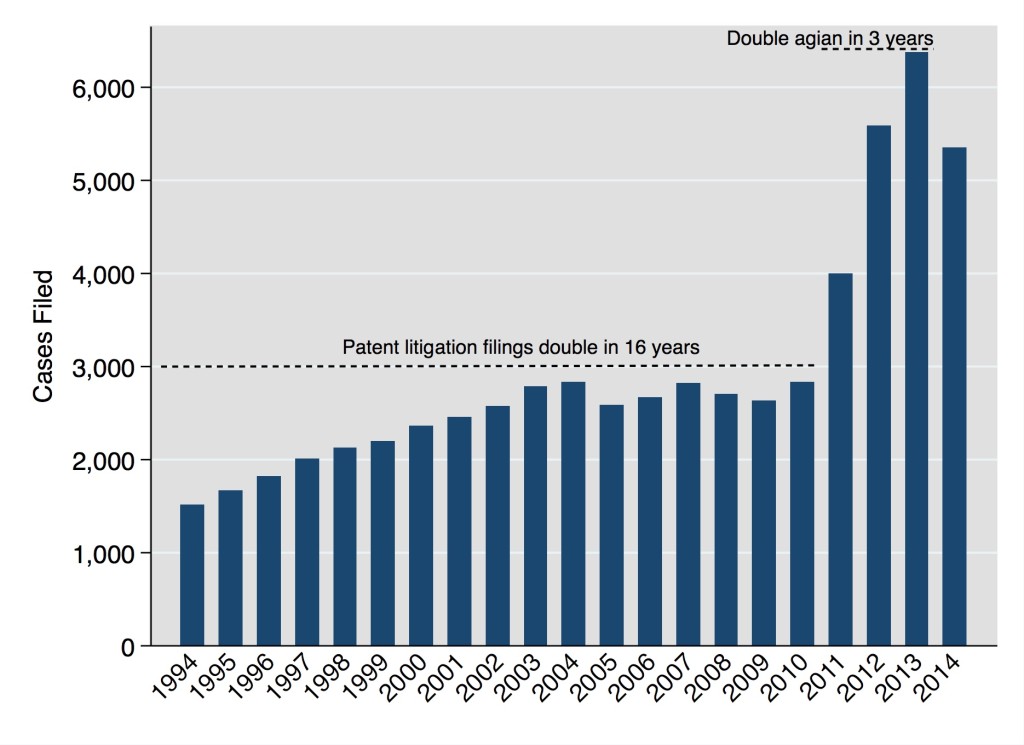
US Patent Litigation Filings, 1994–2014


2/2 The patent litigation explosion is not exactly as it appears, compare suits filed to #defendants.

The real trend in patent litigation over the past two decades can be seen in the number of defendants filed against. The bar chart at the bottom of the next figure shows the same filing data as in the figure above. The scatter plot in the figure below shows the estimated number of defendants. Although it appears that the number of patent cases filed exploded after 2010, looking at the estimated number of defendants, it becomes clear that the period from 2010 to 2013 was more or less a continuation of the existing trend.
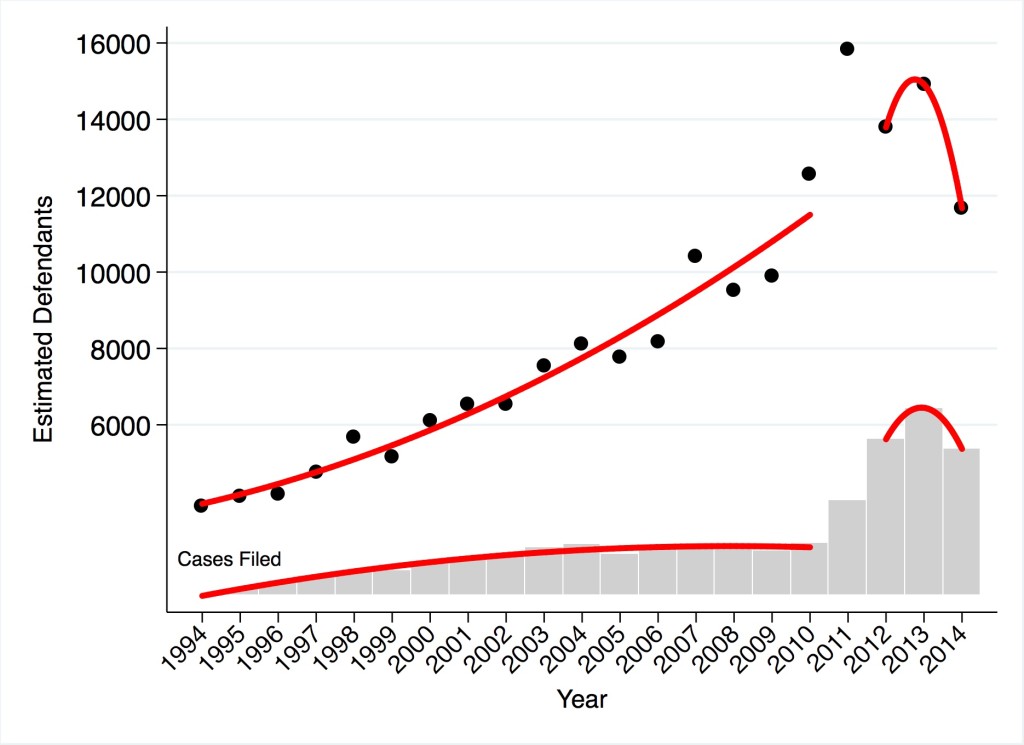
Patent Cases Filed and Estimated Number of Defendants, 1994—2014

There is something wrong with the ED of Texas. Average Number of Patent Defendants per Filing 1994—2014

This figure shows the estimated number of defendants per suit for the nine most popular federal districts from 1994 to 2014 and also for an aggregation of all other districts. The vertical dashed line is set to 2011 to mark the passage of the America Invents Act. It is starkly apparent that the trend toward more defendants is greatest in the Eastern District of Texas. The estimated number of defendants in Eastern District of Texas climbs steeply from 1.66 in 1994 to 12.37 in 2010 and then drops precipitously down to 1.99 in 2014
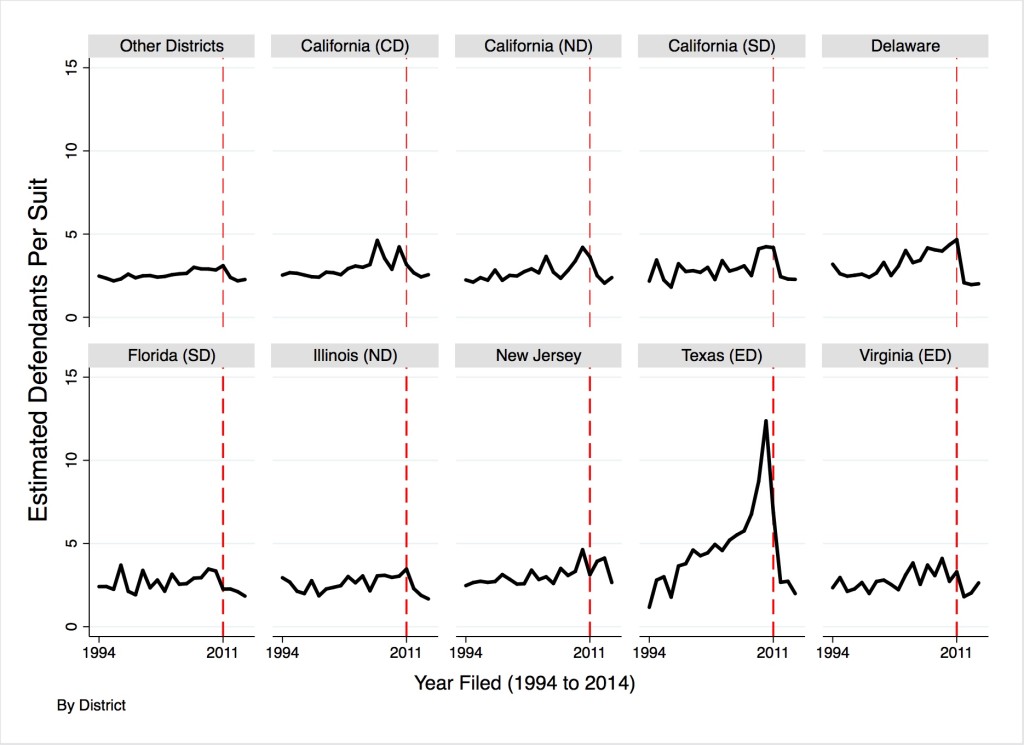
Average Number of Patent Defendants per Filing 1994—2014


What does all this mean? To me, it suggests that there was not exactly a “Troll Fueled Patent Litigation Explosion” between 2010 and 2012. Once you take into account the procedural changes brought into effect in 2011 by the AIA and focus on the number of defendants rather the the number of suits it seem that there was a significant troll fueled increase in the rate of patent litigation; it is just that this increase started earlier and proceeded more smoothly than the simple case filing data suggests. I refer to this revised narrative as the Troll Fueled Patent Litigation Inflation.

District Rankings, Copyright Compared to Trademark (2010-2014)

This figure focuses your attention on the outliers, but the general story is that copyright and trademark litigation are highly correlated at a district court level.
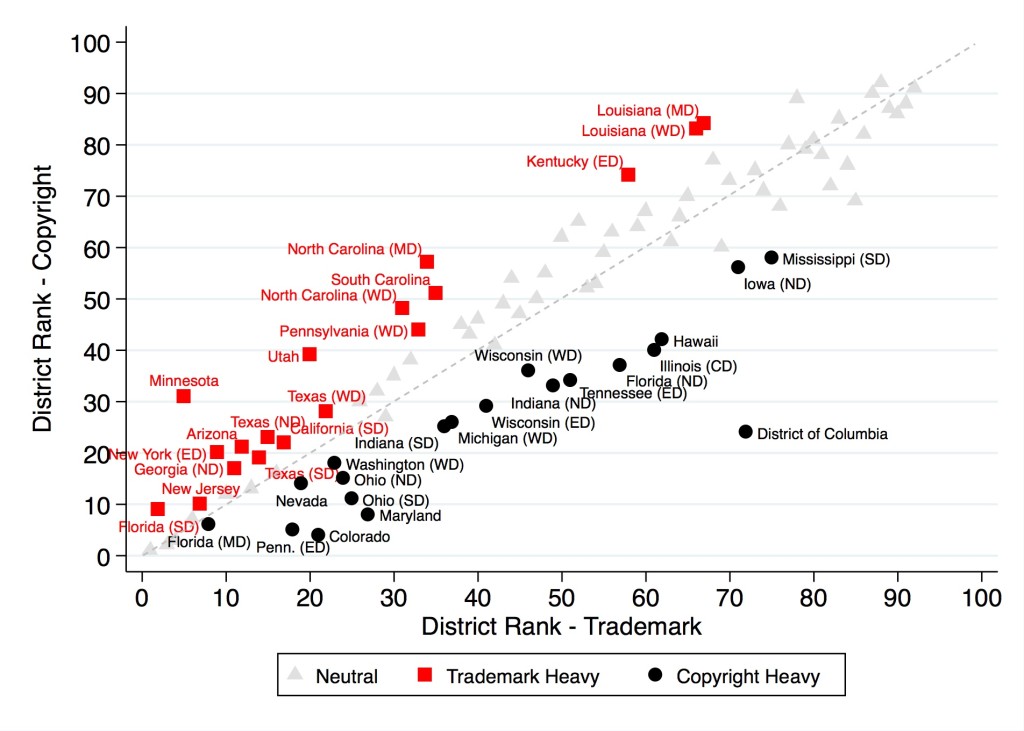
District Rankings, Copyright Compared to Trademark (2010-2014)

Regional Variation in Patent Litigation – Evidence of Forum Selling

The popularity of the Eastern District of Texas as a forum for patent litigation is a well-known phenomenon. However, the data and analysis presented in this study provides a new way of looking at the astonishing ascendancy of this district and the problem of form shopping in patent law more generally. The extent of forum shopping in patent law can be seen by comparing the geographic distribution of patent litigation to that of copyright and trademark. This figure illustrates District rank in terms of patent versus a combined copyright and trademark ranking for cases filed between 2010 and 2014.
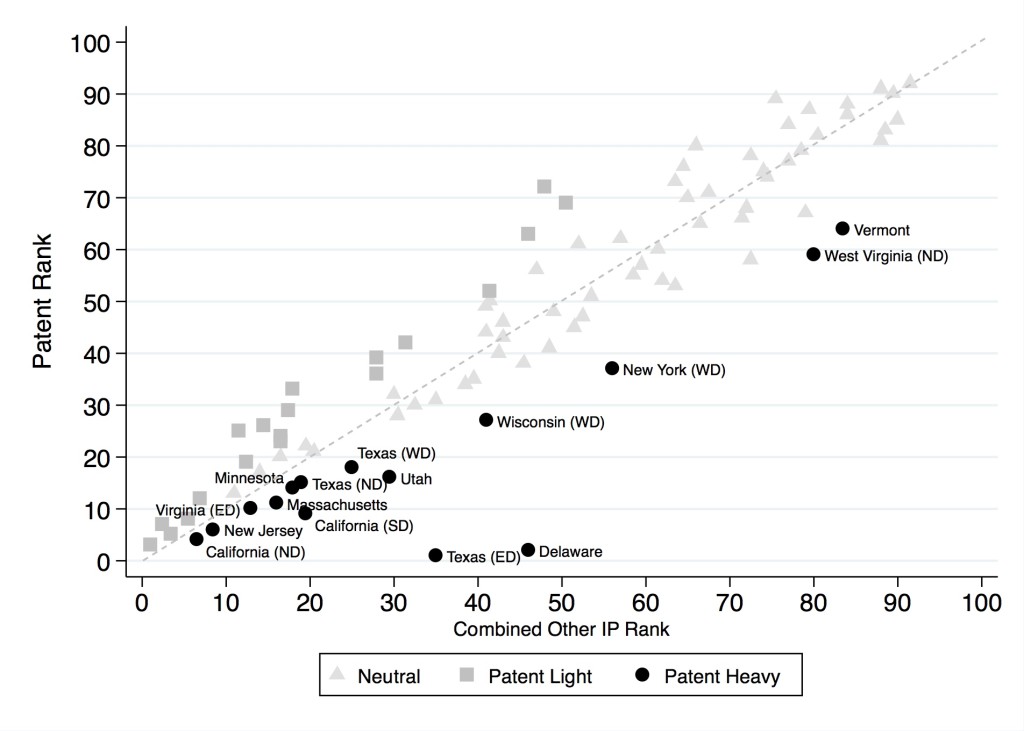
District Rank in terms of Patent versus Copyright and Trademark Combined (2010-2014)

District Court Ranks for Patent Litigation 1994-2014

This is crazy!

My paper explains how we got here and summarizes the excellent work of Jonas Anderson in a new paper titled ‘Court Competition for Patent Cases, and Daniel Klerman and Greg Reilly in ‘Forum Selling’ each of which go into even more detail.
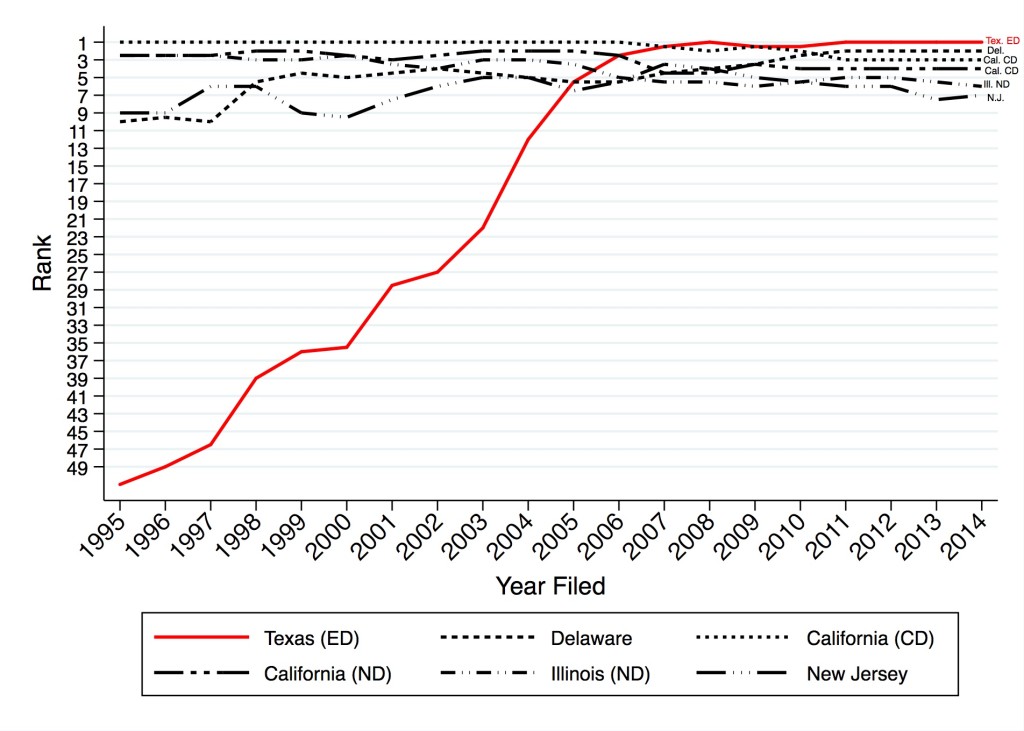
District Court Ranks for Patent Litigation 1994-2014


The first thing to note about this figure is that, but for the Eastern District of Texas and Delaware, the geographic distribution of patent litigation over the past two decades would look remarkably stable. For most of this period, the Central District of California was the most important venue for patent litigation over the last 21 years, followed by the Northern District of California. The Northern District of Illinois has also ranked consistently somewhere between second and sixth over the same period. This relative stability contrasts markedly with the steady gains made by Delaware and the remarkable ascendancy of the Eastern District of Texas between 1994 and 2014. Notice that, were it not for the Eastern District of Texas, the scale on Figure 11 would range from 10 to 1, rather than 50 to 1. Framed accordingly, the steady ascent of Delaware from 9th in 1994 to 2nd from 2011 to the present day would be more noteworthy. However, the rise of the Eastern District of Texas from literal obscurity—it only saw 8 patent cases in 1994—to preeminence over the same period dwarfs all other changes.

New empirical study of IP litigation in US District Courts

IP Litigation in United States District Courts: 1994 to 2014

I have just posted a new empirical study of IP litigation in US District Courts to SSRN. At the moment it has a very boring title: “IP Litigation in United States District Courts: 1994 to 2014”, but I am open to suggestions. [download it here]

What is this article about?

The article undertakes a broad-based empirical review of Intellectual Property (IP) litigation in United States federal district courts from 1994 to 2014.

Why would anyone want to read it?

Unlike the prior literature, this study analyzes federal copyright, patent and trademark litigation trends as a unified whole. It undertakes a systematic analysis of more than 190,000 individual case filings and examines the subject matter, geographical and temporal variation within federal IP litigation over the last two decades.

What is the payoff?

Well, for a start, it is full of cool graphs, figures and tables!

But if you interested in substance, I think that the article makes a number of significant contributions to our understanding of IP litigation.

  • It analyzes time trends in copyright, patent and trademark litigation filings at the national level, but it does much more than simply count the number of cases; it explores the meaning behind those numbers and shows how in some cases the observable headline data can be positively misleading.
  • Exploring the changes in the distribution of IP litigation over time and their regional distribution leads to a number of significant insights (see below).
  • Just as importantly, the article  frames the context for more fine-grained empirical studies in the future. The results demonstrate the dangers of basing empirical conclusions on narrow slices of data from selected regions or selected time periods.

Notable findings

  • The rise of Internet filesharing has transformed copyright litigation in the United States.

More specifically, to the extent that the rate of copyright litigation has increased over the last two decades, that increase appears to be entirely attributable to lawsuits against anonymous Internet file sharers. These lawsuits largely took place in two distinct phases: the first phase largely consisted of lawsuits seeking to discourage illegal downloading; the second phase largely consists lawsuits seeking to monetize online infringement.

  • In relation to patent litigation, the apparent patent litigation explosion between 2010 and 2012 is something of a mirage

However there has been a sustained patent litigation inflation over the last two decades the extent of which has not been fully recognized until now. The reason why this steady inflation was mistaken for a sudden explosion was that the true extent of patent litigation was disguised by permissive joinder.

  • The data and analysis presented in this study provides a new way of looking at the astonishing ascendancy of this district and the problem of form shopping in patent law more generally.

 In relation to the geography of IP litigation, it appears that filings in copyright, patent and trademark litigation are generally highly correlated. The major exceptions to that correlation are driven by short term idiosyncratic events in copyright and trademark litigation—these are discussed in detail—and by the dumbfounding willingness of the Eastern district Texas to engage in forum selling to attract patent litigation. The popularity of the Eastern District of Texas as a forum for patent litigation is a well-known phenomenon.


Chicago Kent Roundtable on Empirical Methods in Intellectual Property

I am presenting some new research at the Chicago Kent Roundtable on Empirical Methods in Intellectual Property tomorrow morning.

I will present some initial data from my work in progress, IP Litigation Trends in United States District Courts: 1994—2014, which undertakes a broad-based empirical review of Intellectual Property (IP) litigation in United States federal district courts from 1994 to 2014. Unlike the prior literature, this study analyzes federal copyright, patent and trademark litigation trends as a unified whole. It undertakes a systematic analysis of more than 180,000 individual case filings and examines the subject matter, geographical and temporal variation within federal IP litigation over the last two decades.

Here is an example of the kind of thing I will be talking about:

District Rank in terms of Patent versus Copyright and Trademark Combined (2004-2014)

Fig4 (Patent vs copyright&trademark)

The figure highlights the difference between patent litigation rankings and the composite copyright/trademark ranking of each federal district and thus provides a measure of forum shopping in patent litigation.


Some measured thoughts on patent trolls

This post expands on the remarks I made today at the Chicago Tech Roundtable meeting on Patent Trolls and Chicago’s Tech Community. The meeting was attended by a number of elected officials and their representatives as well as start-ups such as Jump Rope and Options Away Travel who have had direct experiences with patent trolls. This is an important issue for Chicago’s technology sector.

Trolls and Trolling – The Nature of the Problem

Patent trolls are in the news and they have been high on the agenda of intellectual property policy makers and academics for over a decade now. I started thinking about these issues when I worked as an IP lawyer in Silicon Valley in the early 2000’s. The Federal Trade Commission sounded an important call to action on patent trolls and the balance of competition and patent law and policy in 2003 [FTC, To Promote Innovation: The Proper Balance of Competition and Patent Law and Policy, (2003)], and again in 2011 [FTC, The Evolving IP Marketplace: Aligning Patent Notice and Remedies with Competition (2011)].

I first wrote about these issues in a paper published in 2007, Patent Reform and Differential Impact (with Kurt W. Rohde who was then a student of mine and is now is a partner with McDonnell Boehnen Hulbert & Berghoff LLP), some things have changed since then, but the patent trolls problem persists, it may even be getting worse. In 2012, businesses and individuals targeted by patent aggregators and patent holding companies accounted for 58 37.8% of all patent defendants.

* An earlier version of this post contained the assertion that businesses and individuals targeted by patent aggregators and patent holding companies accounted for 58% of all patent defendants. That was a very unfortunate transcription error.

Not every non-practicing entity, patent aggregator and patent holding company is a necessarily a troll. There is obviously a role in our innovation ecosystem for people who invent but don’t have the complementary skills to commercialize. But the rough and ready correlation between patent assertion entities and trolls seems to fit. Any business that is sending out infringement notices by the hundreds or thousands can’t plausibly be doing the kind of diligence it should take to make a meritorious claim of infringement.

Debating who is and is not a troll is beside the point – it is trolling behavior that we need to address. Trolling is abusive and opportunistic behavior such as asserting bad patents or using patents to extort settlements that are only justified by the threat of legal fees. Trolling is mostly a numbers game – trolls targets hundreds or thousands of defendants, seeking quick settlements priced just low enough that it is easier for the defendant to pay the troll directly rather than pay his lawyers to defend the claim. Anyone who takes part in this kind of systematic opportunism that undermines innovation is a troll, NPE or not.

Patent trolls thrive by opportunistically taking advantage of the uncertain scope of patent claims, the poor quality of patent examination, the high cost of litigation and the asymmetry of risks and costs of litigation. There is nothing wrong with licensing your technology, or with litigating against infringers who would rather take your technology without a license. The patent system is meant to encourage investment in R&D and innovation. Businesses monetizing their technology aught to be celebrated, but using the threat of costly litigation to monetize bad or ill-fitting patent claims takes money away from R&D budgets for no social gain.

Solutions

There will always be opportunists who try to exploit the system – the goal of patent reform should be to limit unproductive rent-seeking while leaving the door open to those businesses that actually contribute to the research and development that makes the U.S. a world leader in so many fields. We need reforms targeted at bad patents such as limiting continuations, rejecting highly abstract functional claims (especially in software and business method patents) and improving the quality of patent examination. But we also need reforms targeted at bad conduct. We need reforms that level the litigation playing field — it is far too easy to impose millions of dollars of defense costs based on dubious patents and tenuous theories of the scope of those patents. Some of the most useful reforms— reforms that leave the door open for well-founded claims — include: fee shifting such that the losing party pays the winning party’s fees in ordinary cases; heightened pleading standards; delaying discovery until after “claim construction,” and limiting discovery to those documents likely to be relevant to the specific litigation at hand. “Consumer stay” provisions would also do a lot to end opportunistic threats of litigation – under this proposal if, for example, a cafe was sued by offering Wi-Future interest to its customers, the manufacturer of the router could intervene and effectively consolidate the cases of all of its customers. Reforms aimed at transparency of patent ownership and taking action against misleading and deceptive language in demand letters would also be of some assistance.

House recently passed the Innovation Act to take up some of these issues and the Senate Judiciary Committee seems close to finalizing a complementary bill. Neither of these bills will put an end to opportunism, but they have the potential to make life a harder for patent trolls and a little easier for the rest of us.

Patent Troll Statistics

According to RPX Corporation PAEs initiated 62% of all patent litigation suits in 2012. [See Colleen Chien, Patent Trolls by the Numbers (http://patentlyo.com/patent/2013/03/chien-patent-trolls.html)] However, it is not exactly clear how RPX determines who is and is not a patent troll. Also RPX is in the business of providing “patent risk management services”, so it is not exactly a disinterested bystander in the patent troll debate.

The best empirical analysis of patent troll numbers  so far is contained by Christopher A. Cotropia, Jay P. Kesan & David L. Schwartz, Unpacking Patent Assertion Entities (PAEs) (working paper available at http://ssrn.com/abstract=2346381). Figure 3 of that paper reports these numbers in terms of the number of individual defendants sued. On this metric:

  • suits by large aggregators and patent holding companies increased from 31.6% of all patent litigation in 2010 to 37.8% in 2012;
  • in contrast suits by operating companies went down from 48.9% in 2010 to 47.3% in 2012;
  • if you include the IP holding companies of operating companies, suits by operating companies went down from 51.0% in 2010 to 47.8% in 2012;

Cotropia, Kesan & Schwartz round out this picture by reporting the numbers for universities & colleges, individuals & family trusts, failed operating companies & failed start-ups, and technology development companies. Some of these suits may be troll litigation, but without case specific information it is hard to tell.