Patent Reform is Working, Everywhere but the Eastern District of Texas?

Is the American Invents Act working?

Taking a look at the longterm trends in case filings and the number of unique defendants in each suit, it appears that the America Invents Act (“AIA”) corresponds with a significant reduction in the real rate of patent litigation and a leveling off of the nominal rate of patent litigation.

Patent Cases Filed and Estimated Number of Defendants, 1994—2015

Figure 5

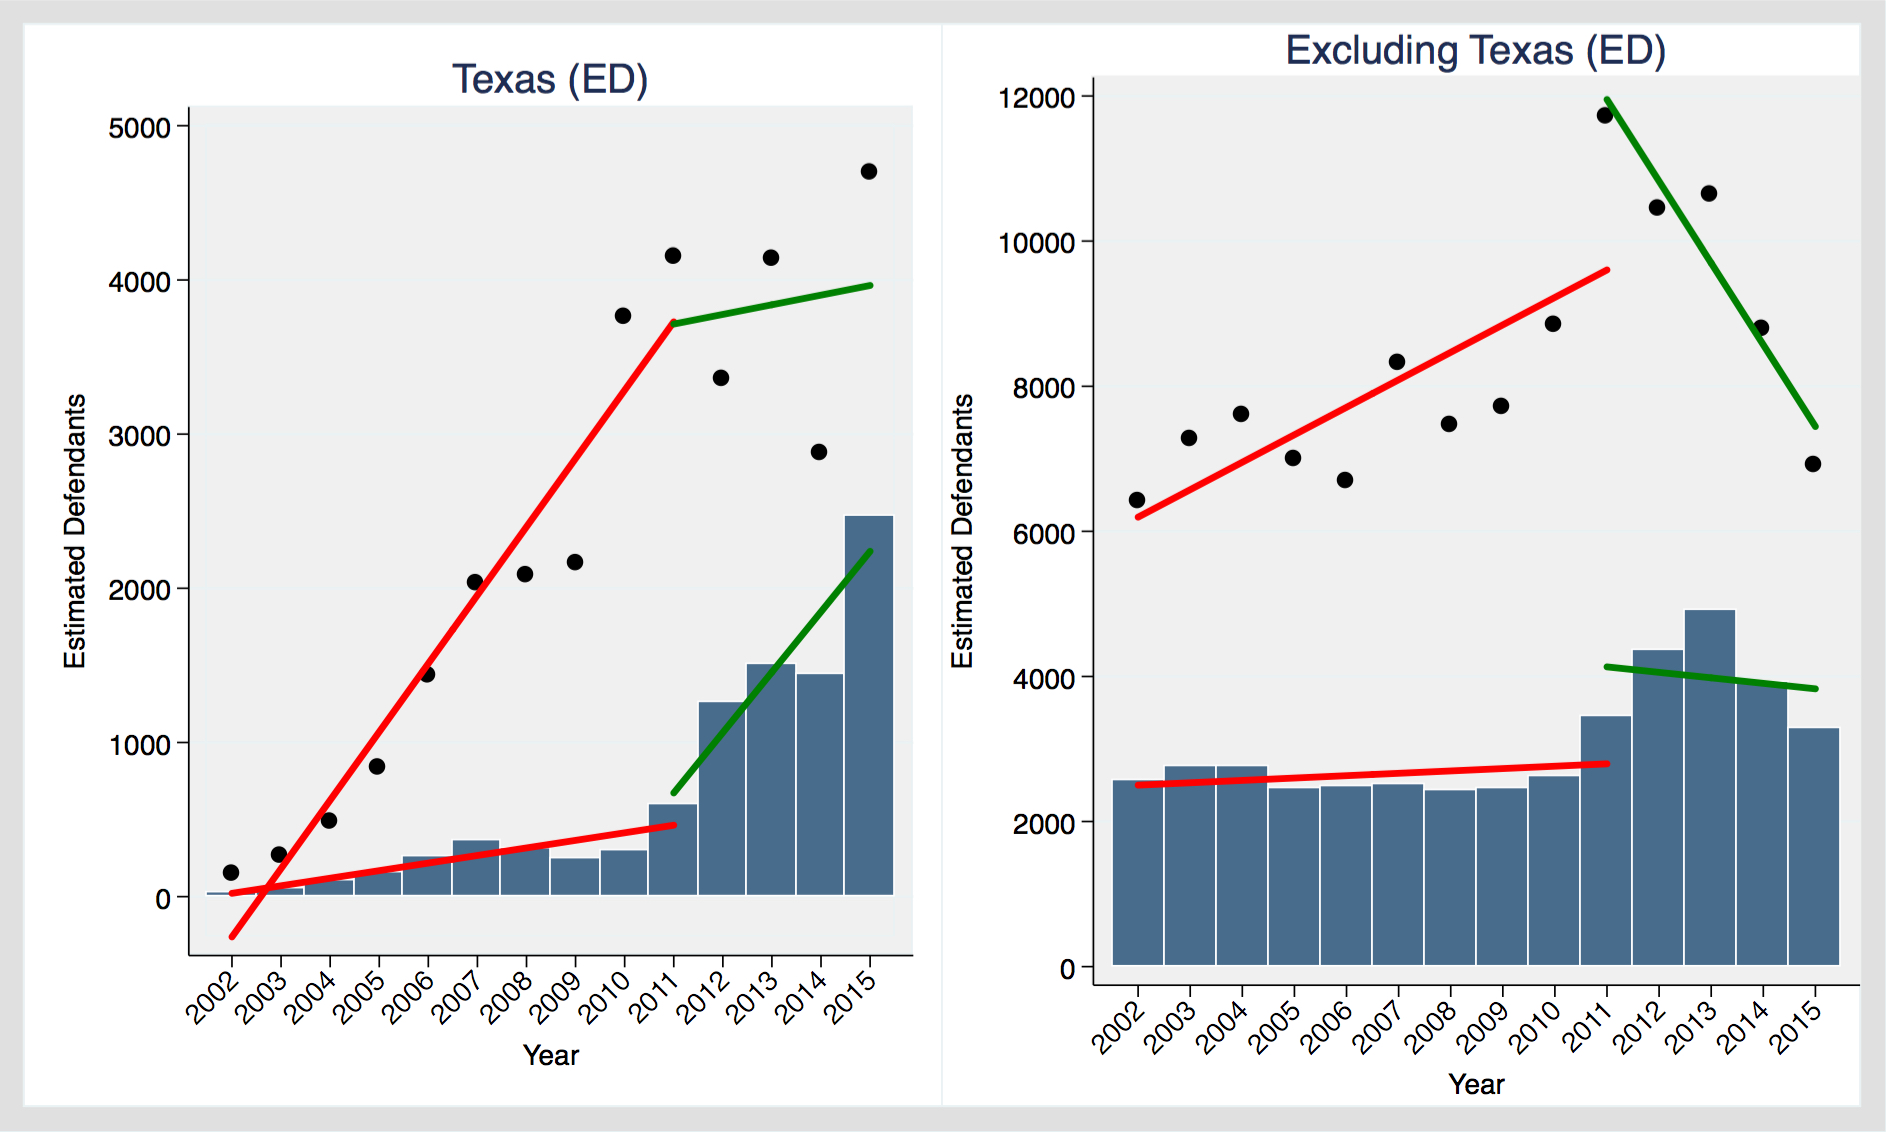
However it is worth desegregating the data to compare the Eastern District of Texas to the rest of the United States. If you believe that most what takes place in Eastern District is patent trolling, then it looks like the AIA has not put a serious dent in that activity. The figure below compares the Eastern District of Texas to the rest of the United States in terms of the number of patent lawsuits filed per year (the bars) and also the estimated number of defendants per year (the scatterplot).

Patent Litigation in Eastern District of Texas, All Other Districts Source: Bloomberg Law, 1994–2015.

comparingtexas

Bar chart depicts cases filed. Scatterplot depicts estimated number of defendants. Linear fit lines from 1994 to 2011 and 2011 to 2015.

Prior to 2011, the whole country witnessed a significant upward trend in patent suits and patent defendants. The rate of increase was much greater in the Eastern District of Texas, but the trendlines were pointed in the same direction for the district and the rest of the US. The period from 2011 to 2015 saw a marked divergence between the Eastern District of Texas and the rest of the country. In the Eastern District, the number of cases filed increased sharply and the trend (albeit with significant variation) was for the number of defendants to increase as well. In the rest of the US, the trendline for the number of defendants is significantly downward and there also appears to be a decreasing trend in terms of the number of suits filed.

These initial numbers might suggest that the patent reform measures introduced in the AIA have had a significant impact on the extent of patent litigation everywhere but the Eastern District of Texas. Another way to read these figures is as confirmation that the Eastern District of Texas’s concerted efforts at forum selling are continuing to be successful. These explanations are not mutually exlusive. The Eastern District of Texas accounted for just 7.33% of all patent cases filed between 2002 and 2010, but 26% from 2011 to 2015. It accounted for 16.39% of all patent defendants between 2002 and 2010, rising to 28.36% in the 2011-2015 period.

According to this superficial data (no attempt to control for marco-economic factors), etc, it looks like the AIA is having an effect, just not in the Eastern District of Texas.

For an extended discussion of the data used in this post, see my forthcoming article, IP Litigation in United States District Courts: 1994 to 2014 (Iowa Law Review, forthcoming 2016). You can download the underlying data on my website (under the publications+/data sets tab).

My 2015 IP Litigation data is now available for replication

Most IP academics agree that their data should be available for replication, but we don’t always follow through in a timely fashion (or at all!). Yesterday I published some analysis of the latest filing data on copyright, patent and trademark litigation in US district courts. Today I published the underlying data on my website (under the publications+/data sets tab). There are two datasets, one derived from Pacer (excel) (stata) and one derived from Bloomberg (excel)(stata).

This data is an UPDATE to the data in my forthcoming article, IP Litigation in United States District Courts: 1994 to 2014 (Iowa Law Review, forthcoming 2016). The updated analysis is summarized in Matthew Sag, IP Litigation in United States District Courts2015 Update (January 5, 2016). Available at SSRN: http://ssrn.com/abstract=2711326.

(4/4) 2015 Data on the geographic distribution of US IP litigation

2015 Update

This is the fourth and final post in a series discussing the 2015 Update to the data in my forthcoming article, IP Litigation in United States District Courts: 1994 to 2014 (Iowa Law Review, forthcoming 2016). You can read the 2015 Update in serial form in the posts that follow, or you can download the entire update as a pdf file from ssrn.com. See Suggested citation, Matthew Sag, IP Litigation in United States District Courts2015 Update (January 5, 2016). Available at SSRN: http://ssrn.com/abstract=2711326.

The previous post discussed recent trends in patent litigation and the true nature of the patent litigation explosion. This post concludes with an update to the data concerning the geographic distribution of copyright, patent and trademark litigation in US district courts.

4. The geographic distribution of copyright, patent and trademark litigation

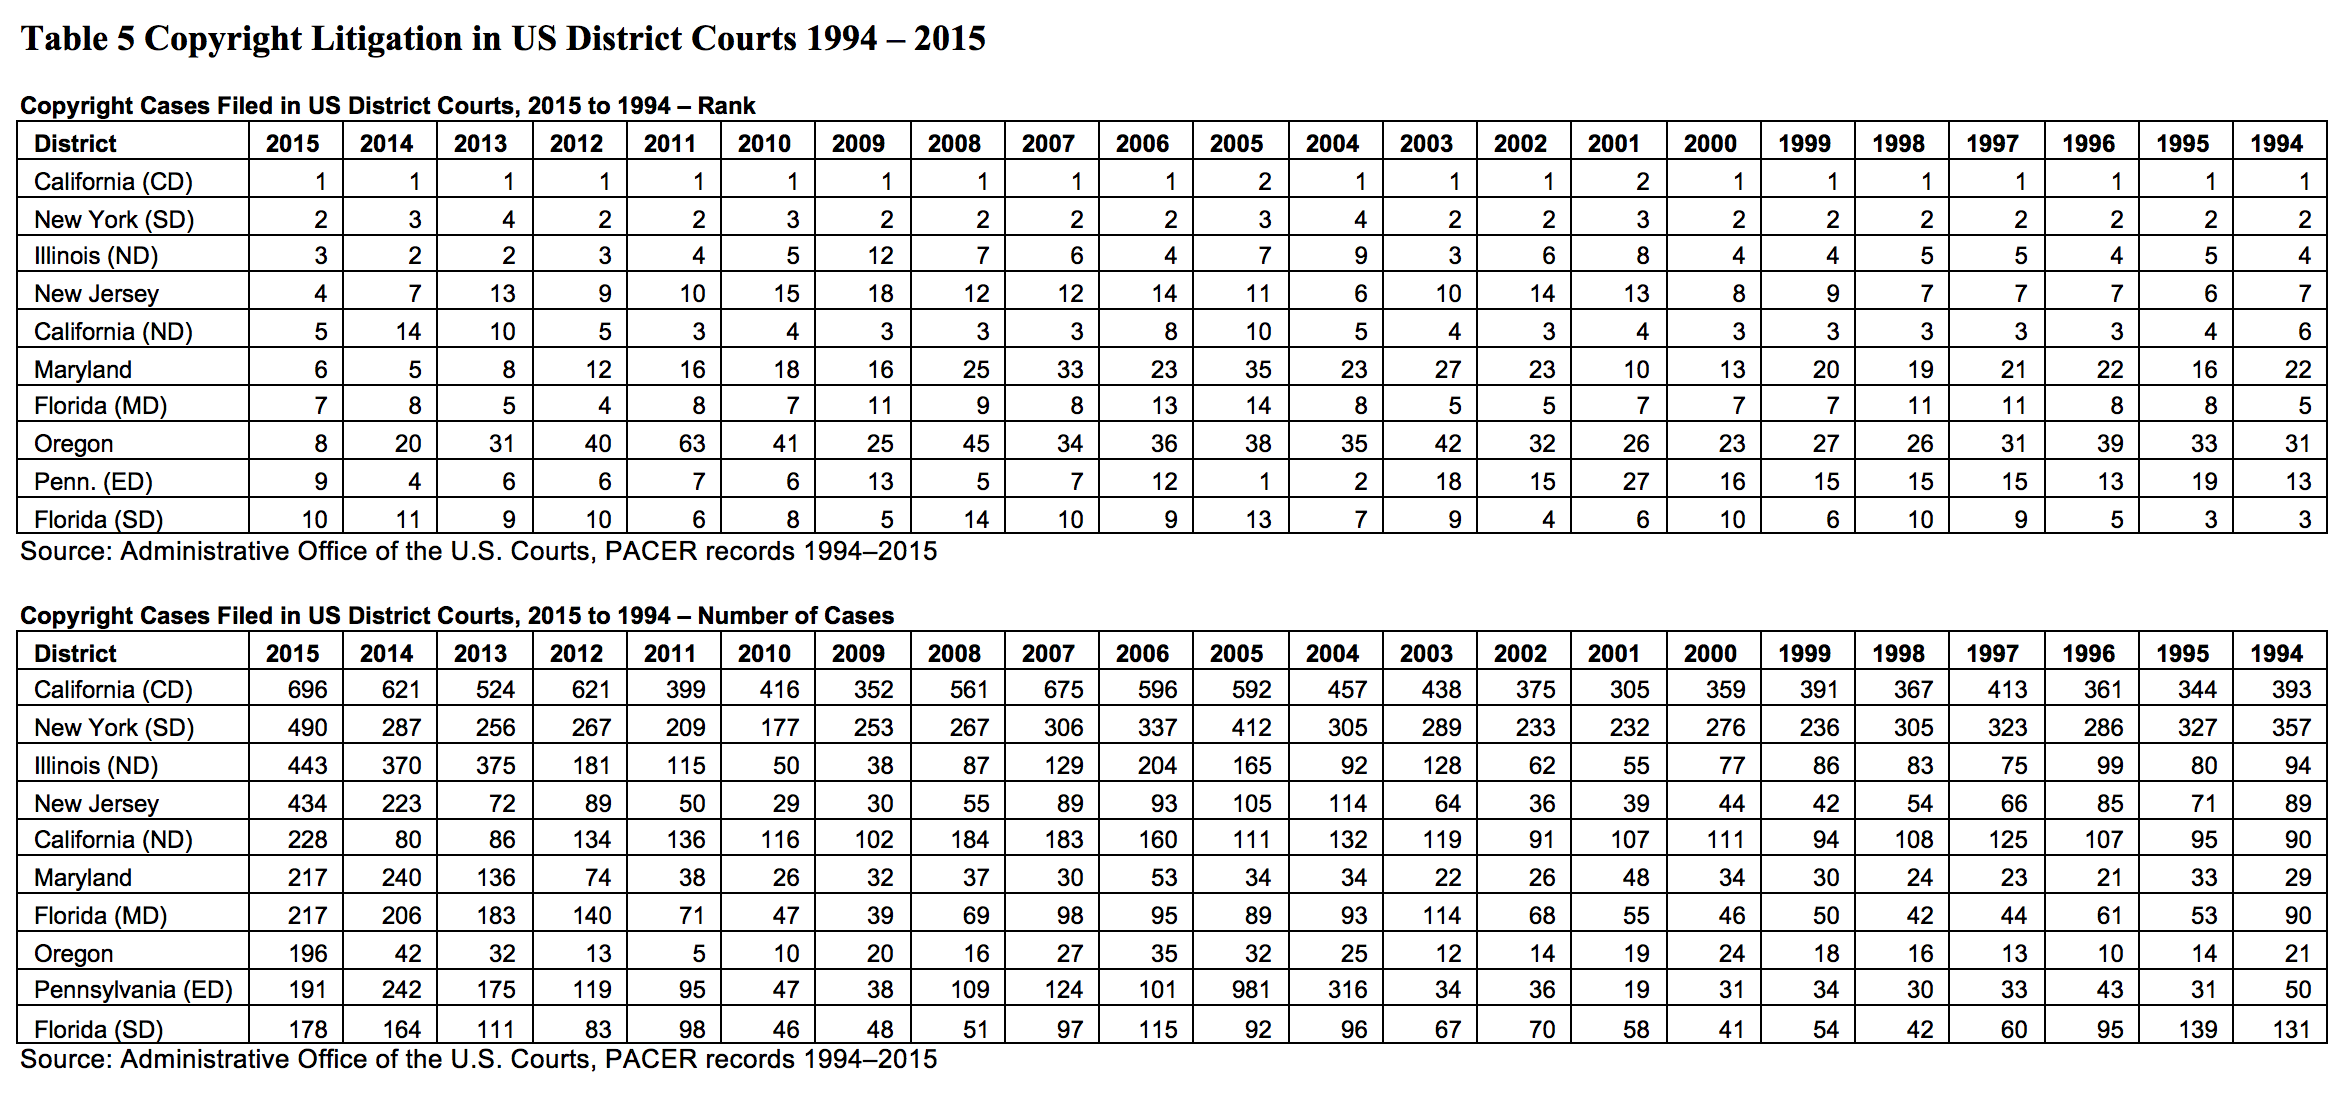
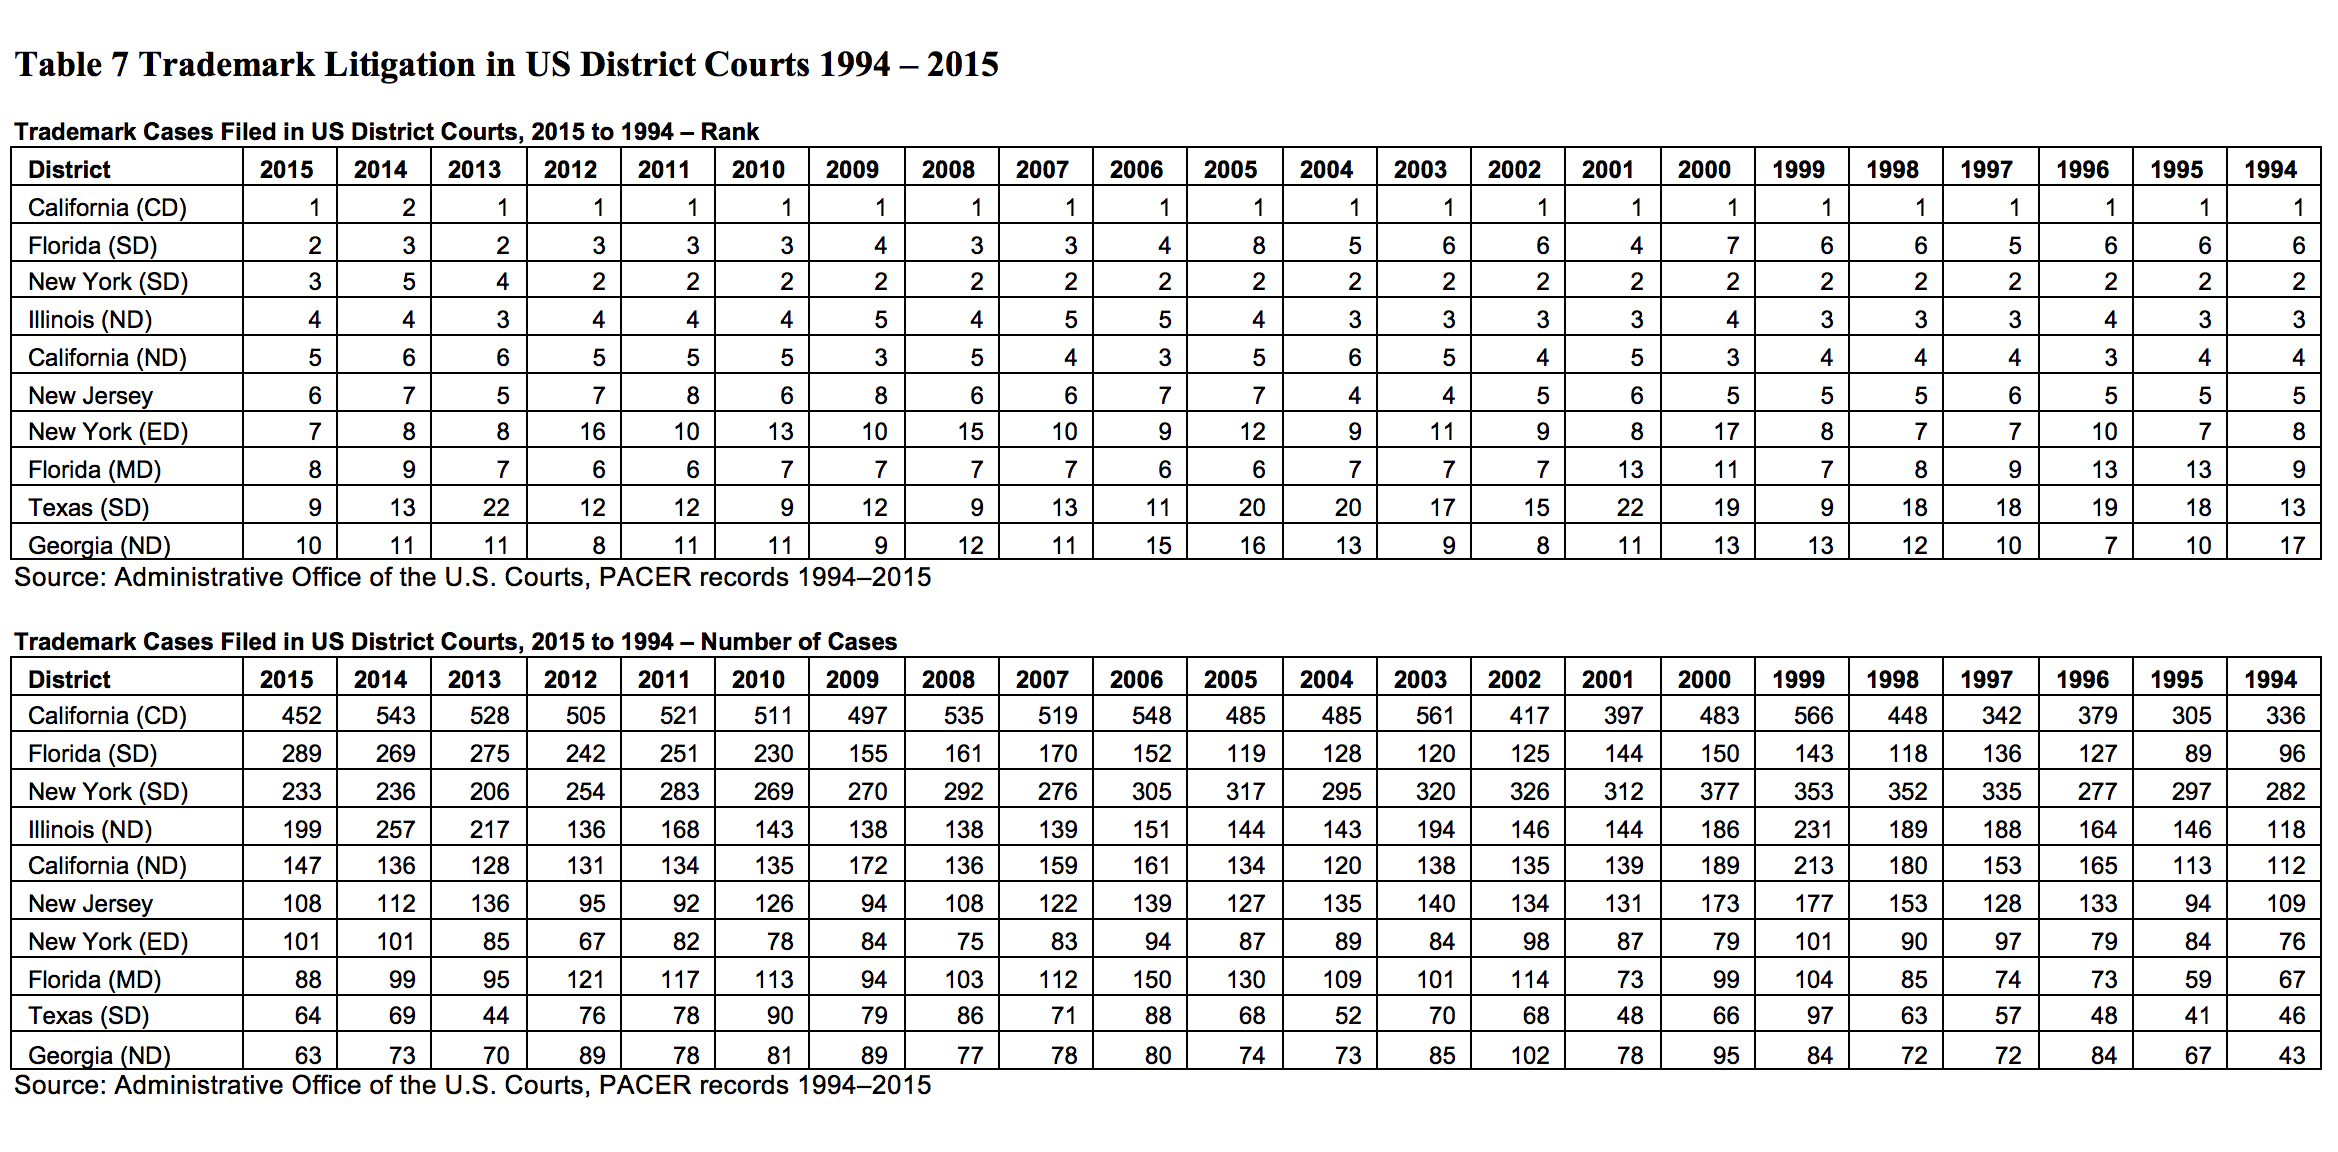
In  IP Litigation in United States District Courts: 1994 to 2014, I discussed at length the geographic distribution of copyright, patent and trademark litigation. I have updated the key figures and tables from that discussion below. Figure 6 (below) illustrates how the copyright, patent and trademark litigation rankings of selected districts have varied from 1994 to 2015.

Figure 6 Copyright, Patent and Trademark Litigation Rankings by District 1994—2014

Spagetti Districts Combined

Source: Administrative Office of the U.S. Courts, PACER records, 1994—2015.

The associated tables are not particularly easy to read in this format, but I have included them for completeness. They are available in text form in the pdf version of this Update, see Matthew Sag, IP Litigation in United States District Courts2015 Update (January 5, 2016)(http://ssrn.com/abstract=2711326).

Screen Shot 2016-01-05 at 11.27.51 AM

Screen Shot 2016-01-05 at 11.28.11 AM

Screen Shot 2016-01-05 at 11.28.25 AM

End of post

(3/4) 2015 Data on Patent Litigation in the US

2015 Update

This is the third  in a series of posts discussing the 2015 Update to the data in my forthcoming article, IP Litigation in United States District Courts: 1994 to 2014 (Iowa Law Review, forthcoming 2016). You can read the 2015 Update in serial form in the posts that follow, or you can download the entire update as a pdf file from ssrn.com. See Suggested citation, Matthew Sag, IP Litigation in United States District Courts2015 Update (January 5, 2016). Available at SSRN: http://ssrn.com/abstract=2711326.

The previous post discussed new data on copyright litigation and the John Doe phenomenon, this post examines recent trends in patent litigation and the true nature of the patent litigation explosion.

3. Patent Litigation

As I explained in IP Litigation in United States District Courts: 1994 to 2014, the filing data gives a misleading impression of the true extent of patent litigation because the rules relating to joinder changed in 2011 with the passage of the America Invents Act. At first glance, it looks as though there was an enormous spike in patent litigation between 2010 and 2012; however, this spike is at least partly attributable to an important procedural change brought about by the AIA. Prior to the AIA, it was common for patent plaintiffs to join multiple unrelated defendants in a single lawsuit based on a commonly-asserted patent or patents. The AIA ended this ruse and resulted in a nominal explosion of patent infringement lawsuits. Figure 4 (below) shows the number of cases filed in each year from 1994 2015 (see the gray bars) but it also shows the estimated number of defendants for each year. Essentially, prior to the America Invents Act of 2011, the true extent of litigation was disguised through permissive joinder of unrelated (or tenuously related) parties. This practice was particularly common in the Eastern District of Texas, the patent troll’s favorite hunting ground (see Figure 5 (below)). Note that although the trend in patent case filings is more or less flat between 2012 and 2015, the number of patent defendants has sharply declined over the same period.

Figure 4 Patent Cases Filed and Estimated Number of Defendants, 1994—2015

Figure 5

Source: Bloomberg Law, 1994–2015. Bar chart depicts cases filed. Scatterplot depicts estimated number of defendants. Quadratic fit lines from 1994 to 2010 and 2012 to 2015 are drawn for illustrative purposes.

The data underlying Figure 4 is also presented in tabular form below.

Table 4 Patent Defendants 1994—2015

Screen Shot 2016-01-05 at 11.18.40 AM

Figure 5 Average Number of Patent Defendants per Filing 1994–2015

figure 6

Source: Bloomberg Law, 1994–2015.

Figure 5 (above) shows the estimated number of defendants per suit for the nine most popular federal districts from 1994 to 2015 and also for an aggregation of all other districts. The vertical dashed line is set to 2011 to mark the passage of the AIA. It is starkly apparent that the trend toward more defendants was driven by the Eastern District of Texas. The estimated number of defendants in Eastern District of Texas climbed steeply from 1.66 in 1994 to 12.37 in 2010 and then dropped precipitously down to 1.99 in 2014. It has fallen further in 2015, to 1.90 defendants per suit.

End of post.

(2/4) 2015 Data on Copyright Litigation in the US

2015 Update

This is the second  in a series of posts discussing the 2015 Update to the data in my forthcoming article, IP Litigation in United States District Courts: 1994 to 2014 (Iowa Law Review, forthcoming 2016). You can read the 2015 Update in serial form in the posts that follow, or you can download the entire update as a pdf file from ssrn.com. See Suggested citation, Matthew Sag, IP Litigation in United States District Courts2015 Update (January 5, 2016). Available at SSRN: http://ssrn.com/abstract=2711326.

The previous post discussed the overall state of copyright, patent and trademark litigation, this post addresses the new data on copyright litigation and the John Doe phenomenon.

2. Copyright Litigation and the John Doe Phenomenon

Figure 2 (above), shows how the dramatic increase in copyright litigation from 2010 to 2015 is almost exclusively attributable to litigation against anonymous Internet file sharers. The figure shows the number of copyright cases including (dashed red line) and excluding (solid red line) cases filed against John Doe defendants. As discussed in Copyright Trolling, An Empirical Study, and IP Litigation in United States District Courts: 1994 to 2014, the rise of Internet filesharing has transformed copyright litigation in the United States. Federal district courts are currently inundated with copyright owner lawsuits against “John Doe” or “unknown” or otherwise unidentified defendants. Figure 3 (below) tracks the occurrence of these John Doe lawsuits from 1994 through 2015. These John Doe lawsuits are almost exclusively related to allegations of illegal filesharing, which explains why they were virtually non-existent prior to 2004.

Figure 3: Copyright Cases Filed in U.S. District Courts (1994—2015)

Figure 3

Source: Administrative Office of the U.S. Courts, PACER records, 1994—2015.

John Doe litigation has not been a static phenomenon. The current era of BitTorrent monetization began in 2010 with a handful of cases filed against large numbers—sometimes more than 5000—IP addresses. Filing suits in this way enabled plaintiffs to economize on filing fees but courts have become significantly more skeptical of the legality and desirability of mass joinder in BitTorrent cases. Based on the data from 2015, it seems that the era of mass joinder is almost completely over. As seen in Table 2 (below), in 2010 the average number of John Doe defendants per suit was over 560; by 2014 it was just over 3 and in 2015 it was barely over 2. As Table 2 also shows, although pornography still dominates John Doe litigation, the phenomenon is becoming increasingly mainstream.

Table 2 John Doe Copyright Cases 2010—2015

Screen Shot 2016-01-05 at 11.03.14 AM

John Doe and pornography cases identified by the author. In 2015 John Doe litigation made up almost 58% of the federal copyright docket (2930 cases out of 5076). One of the most interesting aspects of this phenomenon is that it is driven by such a small number of plaintiffs and— based on my random sampling of the underlying complaints—an even smaller number of lawyers.

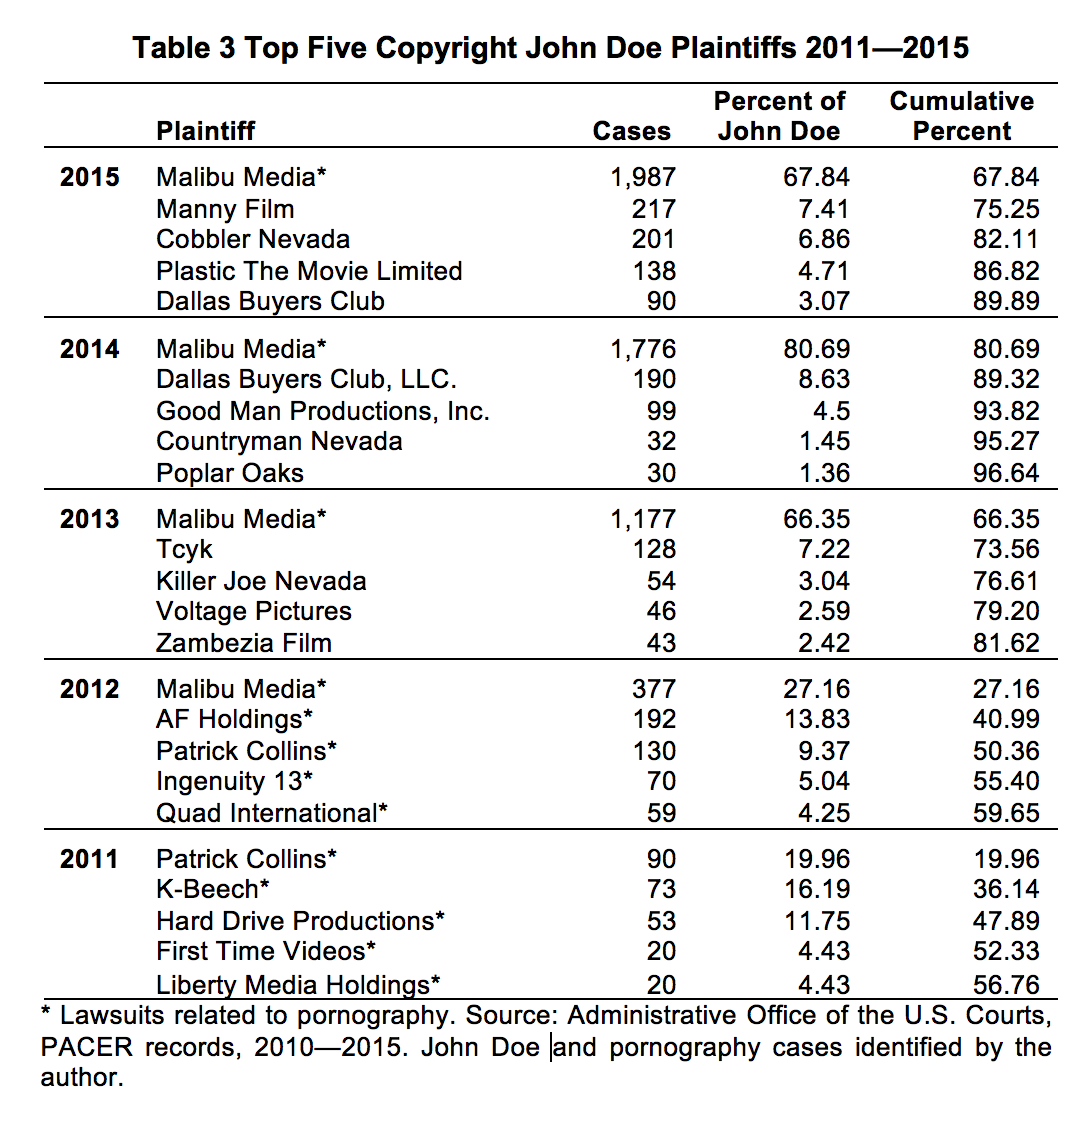
Table 3 shows the five most prolific John Doe litigants for each year from 2011 to 2015. In 2015 Malibu Media was still the most significant individual copyright plaintiff in the US; in fact, it filed more suits than ever last year. However, Malibu Media accounted for a smaller percentage of copyright lawsuits in 2015 because other plaintiffs also ramped up their efforts. Malibu Media accounted for 41.5% of all copyright suits in the US in 2014, and just over 39% in 2015. Malibu Media is represented by Michael Keith Lipscomb of Lipscomb, Eisenberg & Baker, PL. Lipscomb also represents two of the other plaintiffs on the top five list for last year—Manny Film and Plastic The Movie Limited—as well as two of the top five from 2014—Good Man Productions, Inc. and Poplar Oaks, Inc. The filing fee for opening civil action in US district courts is now $400, so that means that plaintiffs associated with Mr Lipscomb have paid at least $936,800 in filing fees over the last year. Given the scale of this enterprise it seems reasonable to infer that Lipscomb and his clients have found a way to effectively monetize online infringement.

Table 3 Top Five Copyright John Doe Plaintiffs 2011—2015

Screen Shot 2016-01-05 at 11.05.36 AM

End of post

(1/4) 2015 Data on IP Litigation in US District Courts

Introduction to the 2015 Update

This is the first in a series of posts discussing the 2015 Update to the data in my forthcoming article, IP Litigation in United States District Courts: 1994 to 2014 (Iowa Law Review, forthcoming 2016).

My original piece, IP Litigation in United States District Courts, undertakes a broad-based empirical review of Intellectual Property (IP) litigation in United States federal district courts from 1994 to 2014. This brief update extends that data to include the year 2015. For a detailed discussion of the data sources and methods, please refer to the original article.

This update contains new data on

  1.  the overall state of copyright, patent and trademark litigation,
  2. copyright litigation and the John Doe phenomenon,
  3. the continuation of the patent litigation explosion and
  4. the geographic distribution of copyright, patent and trademark litigation.

You can read the 2015 Update in serial form in the posts that follow, or you can download the entire update as a pdf file from ssrn.com. See Suggested citation, Matthew Sag, IP Litigation in United States District Courts2015 Update (January 5, 2016). Available at SSRN: http://ssrn.com/abstract=2711326.

1. Copyright and Patent Litigation Increasing, Trademark Litigation Declining

The two most important trends in IP litigation over the last five years have been the extraordinary increase in patent and copyright litigation and the corresponding relative decline of federal trademark litigation. These trends continued in 2015.

Figure 1: Copyright, Patent and Trademark Filings 1994—2015 (Percent)

Figure 1

Twelve month moving average of percent of Federal IP litigation. Source: Administrative Office of the U.S. Courts, PACER records, 1994—2015.

Figure 1 (above) shows the relative proportions of copyright, patent and trademark cases filed, based on a 12 month moving average between 1994 and 2015. As the figure makes plain, the relative shares of copyright, patent and trademark have fluctuated quite significantly over the period. The proportion of cases in the federal IP docket did not change significantly from 2014 to 2015 (39% in 2014, 41% in 2015); however, copyright increased significantly from 32% to 37% and this was matched by a corresponding decline in trademark litigation from 29% to 22%. Complete year-by-year data from 1994 to 2015 are presented in Table 1 (below).

Table 1: Copyright, Patent and Trademark Filings 1994—2015

Screen Shot 2016-01-05 at 10.54.11 AM

The increase in copyright and patent litigation can be seen even more clearly in Figure 2 (below) which shows the raw number of cases filed for each type of IP (displayed as a 12 month moving average).

Figure 2 Copyright, Patent and Trademark Filings 1994—2015 (Cases)

Figure 2

Twelve month moving average of cases filed. Source: Administrative Office of the U.S. Courts, PACER records, 1994—2015.

End of post

Copyright Scholarship Roundtable

Screen Shot 2015-11-05 at 10.17.44 PM

The First Copyright Scholarship Roundtable will begin tomorrow at the University of Pennsylvania Law School. The event is sponsored by U. Penn’s Center for Technology, Innovation & Competition and was organized by Shyam Balganesh and myself (but mostly by Shyam).

I am the assigned commentator for two of the excellent papers: Ben Depoorter’s, Enforcing Against Norms and Kristelia Garcia’s, Facilitating Competition by Remedial Regulation. My slides for Enforcing Against Norms are posted here.

Second Circuit clears the last hurdle for Google Book Search

The Second Circuit ruled today that, in its present form, the library digitization that Google began over ten years ago does not infringe US copyright law. This decision was entirely predictable given the court’s ruling in the related Hathitrust litigation, it is nonetheless momentous. Judge Leval’s cogent explanation of the law and the facts is an exemplary piece of legal writing. The decision is available here (AG v Google October 16, 2015) and merits careful reading.

This is great win for Google, but more importantly, it confirms a balanced approach to copyright law that will ultimately benefit authors, researchers, the reading public and the developers of new forms of information technology.

I have written several law review articles on the issues raised in this case — Orphan Works as Grist for the Data Mill, 27 Berkeley Technology Law Journal 2012, The Google Book Settlement and the Fair Use Counter-factual, and Copyright and Copy-Reliant Technology 103 Northwestern University Law Review 1607–1682 (2009). However, I believe that it was only when I teamed up with Matthew Jockers (a professor of English literature) and Jason Schultz (a law professor with deep experience in public interest litigation in addition to expertise in copyright) to write the amicus Brief Amicus Curiae of Digital Humanities and Law Scholars that my work truly became influential. The court did not cite the any amicus briefs in the case, but they were cited in the district court case and the related Hathitrust cases. Reading Judge Leval’s decision, I think it is clear that the excellent briefing by Google’s lawyers and the many public interest groups who contributed was helpful and influential.

This case is great victory for the public interest, it is also a great illustration of how a deep commitment to scholarship complements law school clinical programs and helps us serve the public interest.

Some cool graphs from my paper on IP litigation in US district courts

I have just revised my article, IP Litigation in US District Courts: 1994 to 2014, which will be published in Volume 101 of the Iowa Law Review next year.  (You can download the article from ssrn now.) This post does not attempt to summarize the full article; it focuses instead on explaining some of the more interesting graphs and data visualizations in the article.

Copyright, Patent and Trademark Filings as a percentage of all IP 1994-2014

This data is presented as a 12 month moving average.

Copyright, Patent and Trademark Filings 1994—2014 (Percent)


Copyright, Patent and Trademark Filings (number of cases) 1994—2014

Again, this data is presented as a 12 month moving average. The difference between the dashed redline and the solid red line clearly shows the impact of lawsuits against anonymous internet file sharers.

Copyright, Patent and Trademark Filings 1994—2014 (Cases)


Copyright Cases 1994—2014, RIAA End-User Litigation, BitTorrent Monetization and Copyright Trolling

The impact of the current wave of copyright trolling is pretty clear.

Copyright Cases Filed in U.S. District Courts (1994—2014)


9 out of 10 of ‘copyright trolling’ cases are about pornography

As you can see from the table, the number of john does per suit has declined because courts have been far more skeptical of mass-joinder, but that has just led to more suits being filed.

Screen Shot 2015-08-20 at 11.03.56 AM


One pornography company accounts for 80% of Copyright John Doe lawsuits filed in 2014 #CopyrightTrolling

In fact, the pornography producer, Malibu Media is such a prolific litigant that in 2014 it was the plaintiff in over 41.5% of all copyright suits nationwide. John Doe litigation is not a general response to Internet piracy; it is a niche entrepreneurial activity in and of itself.

[Edited at 4:17pm. The missing * for AF Holdings has been added]


Screen Shot 2015-08-20 at 4.15.40 PM

1/2 The patent litigation explosion is not exactly as it appears, compare suits filed to #defendants.

At first glance it looks like the annual volume of patent litigation in the United States doubled in the 16 years from 1994 until 2010. In the three years from 2010 to 2013 it doubled again.

US Patent Litigation Filings, 1994–2014


2/2 The patent litigation explosion is not exactly as it appears, compare suits filed to #defendants.

The real trend in patent litigation over the past two decades can be seen in the number of defendants filed against. The bar chart at the bottom of the next figure shows the same filing data as in the figure above. The scatter plot in the figure below shows the estimated number of defendants. Although it appears that the number of patent cases filed exploded after 2010, looking at the estimated number of defendants, it becomes clear that the period from 2010 to 2013 was more or less a continuation of the existing trend.

Patent Cases Filed and Estimated Number of Defendants, 1994—2014

There is something wrong with the ED of Texas. Average Number of Patent Defendants per Filing 1994—2014

This figure shows the estimated number of defendants per suit for the nine most popular federal districts from 1994 to 2014 and also for an aggregation of all other districts. The vertical dashed line is set to 2011 to mark the passage of the America Invents Act. It is starkly apparent that the trend toward more defendants is greatest in the Eastern District of Texas. The estimated number of defendants in Eastern District of Texas climbs steeply from 1.66 in 1994 to 12.37 in 2010 and then drops precipitously down to 1.99 in 2014

Average Number of Patent Defendants per Filing 1994—2014


What does all this mean? To me, it suggests that there was not exactly a “Troll Fueled Patent Litigation Explosion” between 2010 and 2012. Once you take into account the procedural changes brought into effect in 2011 by the AIA and focus on the number of defendants rather the the number of suits it seem that there was a significant troll fueled increase in the rate of patent litigation; it is just that this increase started earlier and proceeded more smoothly than the simple case filing data suggests. I refer to this revised narrative as the Troll Fueled Patent Litigation Inflation.

District Rankings, Copyright Compared to Trademark (2010-2014)

This figure focuses your attention on the outliers, but the general story is that copyright and trademark litigation are highly correlated at a district court level.

District Rankings, Copyright Compared to Trademark (2010-2014)

Regional Variation in Patent Litigation – Evidence of Forum Selling

The popularity of the Eastern District of Texas as a forum for patent litigation is a well-known phenomenon. However, the data and analysis presented in this study provides a new way of looking at the astonishing ascendancy of this district and the problem of form shopping in patent law more generally. The extent of forum shopping in patent law can be seen by comparing the geographic distribution of patent litigation to that of copyright and trademark. This figure illustrates District rank in terms of patent versus a combined copyright and trademark ranking for cases filed between 2010 and 2014.

District Rank in terms of Patent versus Copyright and Trademark Combined (2010-2014)

District Court Ranks for Patent Litigation 1994-2014

This is crazy!

My paper explains how we got here and summarizes the excellent work of Jonas Anderson in a new paper titled ‘Court Competition for Patent Cases, and Daniel Klerman and Greg Reilly in ‘Forum Selling’ each of which go into even more detail.

District Court Ranks for Patent Litigation 1994-2014


The first thing to note about this figure is that, but for the Eastern District of Texas and Delaware, the geographic distribution of patent litigation over the past two decades would look remarkably stable. For most of this period, the Central District of California was the most important venue for patent litigation over the last 21 years, followed by the Northern District of California. The Northern District of Illinois has also ranked consistently somewhere between second and sixth over the same period. This relative stability contrasts markedly with the steady gains made by Delaware and the remarkable ascendancy of the Eastern District of Texas between 1994 and 2014. Notice that, were it not for the Eastern District of Texas, the scale on Figure 11 would range from 10 to 1, rather than 50 to 1. Framed accordingly, the steady ascent of Delaware from 9th in 1994 to 2nd from 2011 to the present day would be more noteworthy. However, the rise of the Eastern District of Texas from literal obscurity—it only saw 8 patent cases in 1994—to preeminence over the same period dwarfs all other changes.

Slides for my presentation on empirical studies of copyright litigation

Empirical Studies of Copyright Litigation. This presentation was part of the conference for the forthcoming Research Handbook – Economics of Intellectual Property Rights –
Volume II Empirical Studies. Northwestern University (August 5, 2015).

I hope to have a draft chapter posted to SSRN soon.

The literature surveyed is summarized below. As far as I know, this is all there is.

  • Barnes, Jeffrey Edward. “Comment: Attorney’s Fee Awards in Federal Copyright Litigation after Fogerty v. Fantasy: Defendants Are Winning Fees More Often, but the New Standard Still Favors Prevailing Plaintiffs.” In 47 UCLA L. Rev. 1381, 2000.
  • Beebe, Barton. “An Empirical Study of the Multifactor Tests for Trademark Infringement”, 94 CALIF. L. REV. 1581, 2006.
  • Beebe, Barton. “An Empirical Study of U.S. Copyright Fair Use Opinions, 1978-2005”, 156 U. Penn. L. Rev. 549, 2008.
  • Cotropia, Christopher A. and James Gibson. “Copyright’s Topography: An Empirical Study of Copyright Litigation.” 92 Texas Law Review 1981, 2014.
  • Ford, William K. “Judging Expertise in Copyright Law.” 14 J. Intell. Prop. L. 1, 2006.
  • Gerhardt, Deborah R. “Copyright Publication: An Empirical Study.” 87 Notre Dame L. Rev. 135, 2011.
  • Rogers, Eric. “Substantially Unfair: An Empirical Examination of Copyright Substantial Similarity Analysis among the Federal Circuits.” 2013 Mich. St. L. Rev. 893, 2013.
  • Landes, William M. “An Empirical Analysis of Intellectual Property Litigation: Some Preliminary Results.” 41 HOUS. L. REV. 749, 2004.
  • Lippman, Katherine. “The Beginning of the End: Preliminary Results of an Empirical Study of Copyright Substantial Similarity Opinions in the U.S. Circuit Courts”, 2013 Mich. St. L. Rev. 513, 2013.
  • Liu, Jiarui. “Copyright Injunctions After Ebay: An Empirical Study.” 16 Lewis & Clark L. Rev. 215, 2012.
  • Netanel, Neil Weinstock. “Making Sense of Fair Use.” 15 Lewis & Clark L. Rev. 715, 2011.
  • Nimmer, David. “Fairest of Them All and Other Fairy Tales of Fair Use.” 66 LAW & CONTEMP. PROBS. 263, 2003.
  • Priest, George L. & Benjamin Klein. “The Selection of Disputes for Litigation.” 13 J. LEGAL STUD. 1, 1984.
  • Sag, Matthew. “Predicting Fair Use”, 73 Ohio St. L.J. 47, 2012.
  • Sag, Matthew. “Empirical Studies of Copyright Litigation: Nature of Suit Coding 7.” Loyola Univ. Chi. Sch. of Law Pub. Law & Legal Theory, Research Paper No. 2013-017, 2013), available at http://ssrn.com/abstract=2330256, 2013.
  • Sag, Matthew. “Copyright Trolling, An Empirical Study.” In 100 Iowa L. Rev. 1105, 2015.
  • Sag, Matthew. “IP Litigation in United States District Courts: 1994 to 2014” Iowa Law Review, Forthcoming. Available at SSRN: http://ssrn.com/abstract=2570803, 2016.
  • Samuelson, Pamela. “Unbundling Fair Uses”, 77 Fordham L. Rev. 2537 (2009).